C/2011 L4 PanSTARRS from the point of view of our research

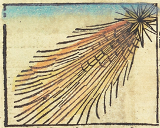
Figure 1. The predicted positions of C/2011 L4 PanSTARRS
as seen from Poland in the middle of March 2013.
Comet C/2011 L4 PanSTARRS
In March 2013 we expect to see the bright comet C/2011 L4 PanSTARRS. Current estimations predict its maximum brightness to reach 2m. Current photometry as well as the brightness prediction can be found on Seiichi Yoshida's page.
In Figure 1 we present approximate positions of this comet on the sky in a few days in March as seen from Poland. March 12 and 13 will be a special opportunity for astro-photographers due to the proximity of the comet and the crescent Moon.
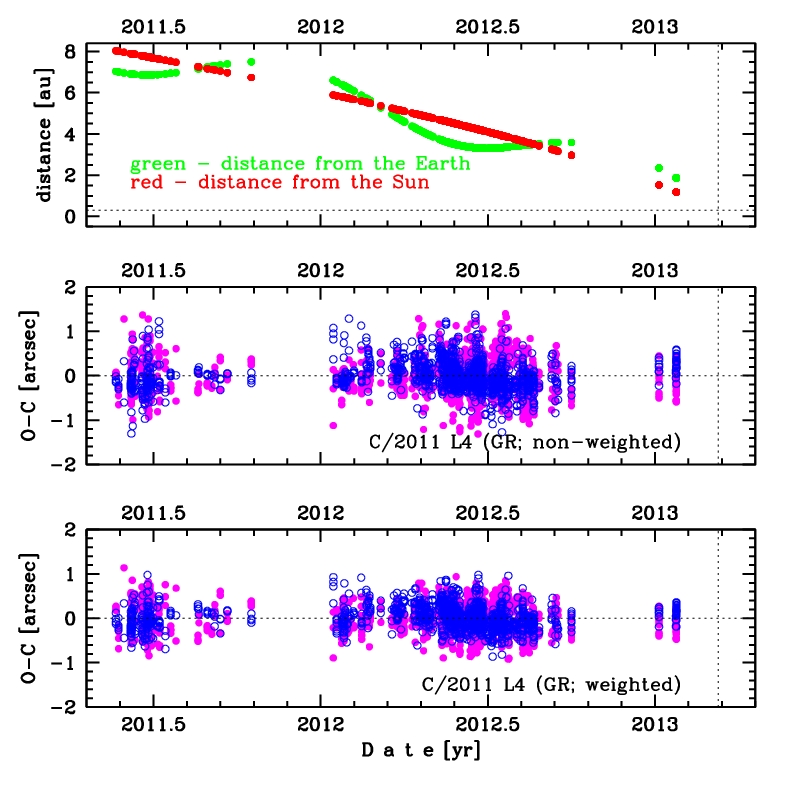
Figure 2. Positional material for Comet C/2011 L4 PanSTARRS
(data interval: 2011 May 21 - 2013 Jan. 23).
Basing on 1371 positional observations made up to 2013 Jan. 23 we determined an orbit of this comet and studied its dynamical history. In figure 2 we plot the structure of the observational material, including current geo- and heliocentric comet distance.
In Figure 2 one can find:
- Top panel: Time distribution of positional observations with corresponding heliocentric (red curve) and geocentric (green curve) distance at which they were taken. Horizontal dotted line shows the perihelion distance from the Sun, the moment of perihelion passage is shown by dashed vertical line.
- Middle and bottom panels: The O-C diagrams for pure gravitational orbits derived from data shown in the upper panel, where the middle panel represent non-weighted data, and the bottom - weighted data (for more details see our Paper 1). Residuals in right ascension are shown as magenta dots and in declination as blue circles; the moment of perihelion passage is shown by dashed vertical line.
Orbit of C/2011 L4 PanSTARRS
Pure gravitational nominal solution for weighted data
   Observational arc:        2011 May  21 - 2013 Jan. 23
   Number of observations:   1371
   RMS:                      0.30 arcsec (2689 residuals used, 2.0% rejected residuals )
Heliocentric osculating orbit
  Epoch        Perihelion time     q                 e                 ω              Ω              i
  2012 03 20   20130310.15149744   0.30161155412     1.00008776117   333.64224440    65.66542759    84.19900155
                    ± 0.00006625   0.00000043087     0.00000017828     0.00003346     0.00000250     0.00003249

  NG parameters:
   A1 = 0
   A2 = 0
   A3 = 0
Barycentric nominal original orbit (at 250 AU from the Sun)
  Epoch        Perihelion time     q                e                 ω               Ω              i
  1715 11 13   20130310.24232111   0.30142043851    0.99999067552   333.642244399    65.64650670    84.08591269
                    ± 0.00006668   0.00000043428    0.00000017568     0.00004161      0.00000405     0.00003259
   1/aori =  (+30.94 ± 0.59)×10-6 AU-1
Barycentric nominal future orbit (at 250 AU from the Sun) — will be given after perihelion passage
Past evolution of C/2011 L4 PanSTARRS
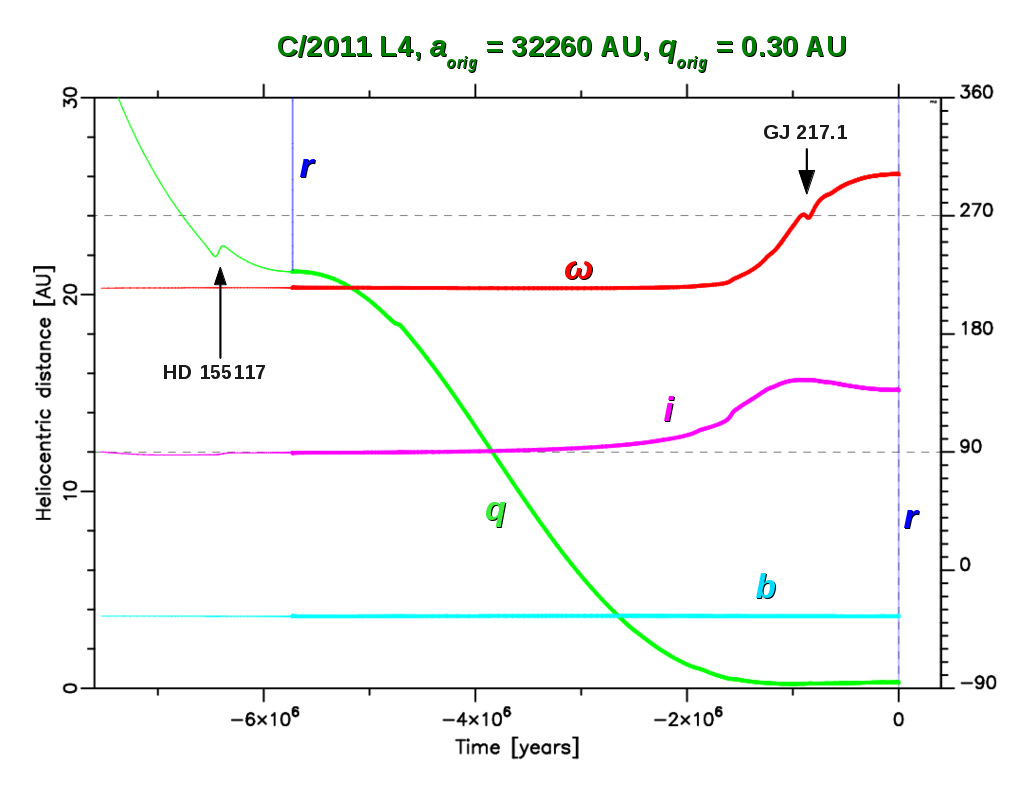
Figure 3. Backward dynamical evolution
of the nominal orbit of C/2011 L4 PANSTARRS.
Starting from original swarm of 5001 virtual comets (VCs) orbits derived on the basis of data presented above, we followed the dynamical evolution of C/2011 L4 PanSTARRS under Galactic tides (both disc and central terms were included) and stellar perturbations; for more details see our Paper2.
In Figure 3. we plotted the past orbital evolution of the nominal VC for C/2011 L4. The horizontal axis shows the moment of osculation for which orbital elements are calculated and plotted; the zero-point corresponds to the forthcoming perihelion passage. The left vertical axis is expressed in AU and describes both the heliocentric distance of a VC ( r, thin vertical blue lines) and its osculating perihelion distance ( q, continuous, green line). The right vertical axis describes angular elements (with respect to the Galactic frame) and is expressed in degrees. We plot here the evolution of the argument of perihelion (ω, red line), inclination (i, magenta line) and the Galactic latitude of perihelion (b, cyan line).
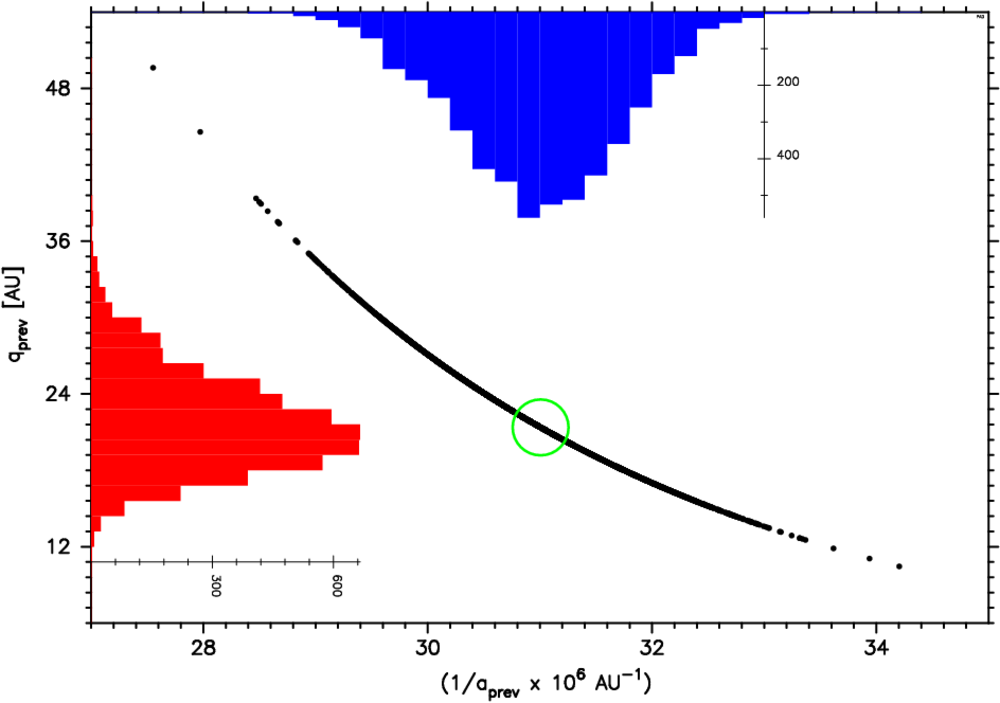
Figure 4. Previous perihelion distance−semimajor axis
distribution for C/2011 L4.
All 5001 VCs were stopped at the previous perihelion.
The centre of the green circle marks the nominal orbit,
which evolution is presented in Figure 3.
As it is easy to see, this comet passed its previous perihelion 5.6 Myr ago at about 22 AU [deciles are 18.05 (10%) : 21.55 (50%) : 25.77 (90%)]. The effect of stellar perturbation is clearly visible in this picture (small, wavy features), especially the local change in the argument of perihelion due to the GJ 217.1 (2.4 solar masses) and a small change in perihelion distance due to the interaction with HD155117 (1.2 solar masses). The thin lines describing the element evolution before the previous perihelion should be treated as more or less "theoretical" since we cannot take into account any planetary perturbations during the previous perihelion passage over 5 mln years ago. The previous perihelion distance value shows that C/2011 L4 seems to be dynamically new comet.