Where do long-period comets come from?
Moving through the Jupiter–Saturn barrier.
Piotr A. Dybczyński1 & Małgorzata Królikowska2
1.Astronomical Observatory Institute, A.Mickiewicz University, Poznań, Poland.
2.Solar System Dynamics and Planetology Group,Space Research Centre, Polish Academy of Sciences, Warsaw, Poland.
ABSTRACT
The past and future dynamical evolution of all 64 long-period comets having 1/aori< 1×10⁻⁴ AU-1 and qosc > 3.0 AU and discovered after 1970 is studied. For this sample of Oort-spike comets we have obtained a new, homogeneous set of osculating orbits, including 15 orbits with detected non-gravitational parameters. The non-gravitational effects for 11 comets have been determined for the first time. This means that more than 50% of all comets with perihelion distances between 3 and 4 AU and discovered after 1970 show detectable deviations from purely gravitational motion. Each comet was then replaced with a swarm of 5001 virtual comets representing the observations well. These swarms were propagated numerically back and forth up to a heliocentric distance of 250 AU, constituting sets of original and future orbits together with their uncertainties. This allowed us to show that the 1/aori distribution is significantly different in shape as well as in maximum position when non-gravitational orbits are included. Next, we followed the dynamical evolution under Galactic tides for one orbital revolution to the past and future, obtaining orbital elements at the previous and next perihelion passages. We obtained a clear dependence of the last revolution change in perihelion distance on 1/aori, which confirmed theoretical expectations.
Based on these results, we discuss the possibility of discriminating between dynamically new and old comets with the aid of their previous perihelion distances. We have shown that about 50% of all comets investigated have their previous perihelion distance below the 15-AU limit. This resulted in classifying 31 comets as dynamically new, 26 as dynamically old and 7 as having unclear status. We showed that this classification seems to be immune to perturbations from all known stars. However, discoveries of new, strong stellar perturbers, while rather improbable, may change the situation. We also present several examples of cometary motion through the Jupiter–Saturn barrier, some of them with a previous perihelion distance smaller than the observed one. New interpretations of the source pathways of long-period comets are also discussed in the light of the suggestions of Kaib & Quinn (2009).
1 INTRODUCTION
As Martin Duncan (2009) recently pointed out, forthcoming deep, wide-field observational surveys (both ground-based and spacebased) will soon be providing completely new data on very large perihelion distance comets, far behind Saturn. This may extend our possibilities of investigating the source regions of long-period comets (LPCs). However, to date the only observational constraint on the source of LPCs is the detailed analysis of observations, ranging up to 10 AU or so, to determine their orbits and study their past dynamical evolution. Continuing our efforts in this field (see Królikowska & Dybczyński 2010, hereafter Paper I) we have analysed the sample of the next 64 comets from the so-called ‘Oort spike’, all of which have an osculating perihelion distance greater than 3 AU; four comets with qosc > 3.0 AU and determinable nongravitational (hereafter denoted as NG) orbits were taken from Paper I. A detailed description of our sample can be found in Section 2. In brief, the reason for such a selection was to deal with comets with negligible NG forces due to their large heliocentric distance. However, during the data analysis we attempted to determine the NG force parameters and it appeared that it was reasonable to use such a model for another 11 comets. Thus, including the four comets from Paper I we have obtained in total 15 large perihelion distance comets with NG parameters and used these in original/future orbit determinations; details can be found in Sections 2.1–2.3. In this paper we again search for the source region of the Oort spike comets. To this purpose we carefully analysed the past and future dynamical evolution of 64 comets under planetary and Galactic perturbations (see Section 3). This, additionally, gives us an opportunity to observe how the mechanism widely called the Jupiter– Saturn barrier works in practice (see Sections 1.1 and 3). The widely disputed problem of discriminating between dynamically (and physically) new and old comets is revisited in Section 4 including a discussion of our results in the light of the newly proposed alternative cometary origin scenario (Kaib & Quinn 2009). A final discussion and conclusions are presented in Section 5.
1.1 ON THE JUPITER-SATURN BARRIER
The concept of the Jupiter–Saturn barrier can be traced back 30 years or so. In 1981, Fernández presented the dependence of comet energy changes due to planetary perturbation on the perihelion distance. It appeared that for perihelion distances smaller than 15 AU this perturbation is comparable with the LPC binding energy.
Later on, as a result of some numerical simulations, Weissman (1985) stated that 65% of comets coming closer to the Sun than Saturn (and 94% closer than Jupiter) will be ejected from the Solar system as a result of planetary perturbations.
The results of planetary perturbation investigations were then combined with the model of Galactic-disc tides. Matese & Whitman (1989) showed that it is possible to calculate the minimum cometary semimajor axis for which Galactic perturbations can decrease the cometary perihelion distance from above the strong planetary perturbation border down below the observability limit in one orbital period. Using 15 AU as the former and 5 AU as the latter, they obtained a minimum semimajor axis equal to 20 000 AU. Investigating Galactic perturbations in a way somewhat similar to ours, Yabushita (1989) obtained a very strong dependence of the perihelion distance reduction by Galactic tides on the cometary semimajor axis, namely Δq ~ a6.3. His conclusion was that 25 000 AU is the most probable semimajor axis of LPCs arriving at the vicinity of the Sun for the first time. Finally, in a review paper, Fernández (1994) devoted a separate section to the description of the Jupiter–Saturn barrier mechanism. It was also later discussed by many other authors (see for example Festou, Rickman & West 1993; Levison, Dones & Duncan 2001; Dones et al. 2004; Fernández 2005; Morbidelli 2005).
This effect can be described in brief as follows: the Galactic perturbations can result in a continuous cometary perihelion drift towards the Sun. The rate of this drift strongly depends on a cometary semimajor axis that remains almost constant. If we agree that a perihelion distance smaller than 10–15 AU results in ejection from the Solar system by perturbations from Jupiter and Saturn, the only possibility for comets to become observable is to have their perihelion distance reduced from above 10–15 AU to below the observability limit, say 3–5 AU. Based on the Galactic tide model, it is possible to calculate the minimum necessary semimajor axis to accomplish this.
Such a calculation can be performed in several slightly different formalism, but only two factors can change the result significantly: the amplitude of the necessary perihelion distance reduction and the assumed Galactic disc matter density ρ. In almost all papers the authors demand a perihelion reduction by ∼10 AU (from above 10– 15 AU to below 3–5 AU) but they use different disc matter densities. In earlier papers (Matese & Whitman 1989; Festou et al. 1993) researchers used ρ = 0.185 solar masses per cubic pc, later (see for example Wiegert & Tremaine 1999; Morbidelli 2005) ρ = 0.150 was used. In all recent papers the value of ρ = 0.100 solar masses per cubic pc is used; see Levison et al. (2001) for a supporting discussion of this density value.
As a consequence, while previously obtained results (a > ∼20 000 AU) were roughly in line with observations, now the situation is more complicated. In a review by Dones et al. (2004) one can read, ‘If we assume that a comet must come within 3 AU of the Sun to become active and thus observable, Δq must be at least ∼10 AU – 3 AU = 7 AU. It can be shown that, because of the steep dependence of Δq on a, this condition implies that a > 28 000 AU.’ However, there are many observed Oort-spike comets with much smaller semimajor axes!
There is also an additional aspect of the Jupiter–Saturn barrier. The resulting semimajor axis threshold value is often applied as a definition of the border between the outer (observable) and inner (unobservable) parts of the Oort cloud. Now, with the current value of this threshold (a > 28 000 AU) it seems to be problematic. Recently Kaib & Quinn (2009) revisited the Jupiter–Saturn barrier problem and they come to several interesting new conclusions. We will discuss these in Section 4.4. In what follows we present some examples showing how different the behaviour of many observed Oort-spike comets is from the above theory.
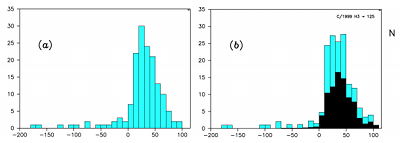
Fig. 1. Distribution of 1/aori × 106 AU-1 for all LPCs with class 1 orbits and 1/aori < 10−4 AU−1. (a) 153 comets with 1/aori taken directly from MWC08 (the splitting event product C/1996 J1-A was omitted), (b) 165 Oort-spike comets; the black part of the histogram denotes 86 comets with orbits determined in this paper and Paper I. We increased the MWC08 sample by 12 comets and determined the NG orbits for 37 comets.
2 THE SAMPLE OF LARGE PERIHELION LONG-PERIOD COMETS
The latest published Catalogue of Cometary Orbits (Marsden & Williams 2008, hereafter MWC08) includes 154 Oort-spike and hyperbolic comets (1/aori < 10-4 AU-1) with orbits determined with the highest precision, i.e. with quality class 1, according to the classification introduced by Marsden, Sekanina & Everhart (1978). Their 1/aori distribution, based on catalogue data, is shown in Fig. 1(a). In the present investigation we chose to study a sample of the Oortspike comets with large perihelion distances, q ≥ 3.0 AU. MWC08 contains 76 such comets. According to the availability of astrometric data, we restrict this sample to comets discovered after 1970. Additionally, in order for orbits to be determined definitely, we did not analyse three still potentially observable comets in October 2010: C/2005 L3, C/2006 S3 and C/2007 D1. Thus, our sample was reduced to 62 comets with orbits of quality class 1 in MWC08. Recently, this sample has increased by two comets (C/2006 YC, C/2007 Y1) that have orbits with quality class 2 in MWC08, but since then the number and interval of observations have been increased significantly, allowing for much more precise orbit determination. This makes a total number of 64 LPCs studied in the present paper. The combined 1/aori distribution containing MWC08 comets superposed and supplemented by our results is presented in Fig. 1(b). One can observe the influence of our new results on the overall shape of the histogram as well as the position of the 1/aori maximum. The black part consists of all 86 comets investigated in Paper I and the present research. It should be stressed here that during the orbit determination process we obtain the 1/aori value as well as its uncertainty. The uncertainties are taken into account when constructing the black part of the histogram depicted in Fig. 1(b). It is evident that incorporating NG effects in orbit determination (where possible) moves the overall distribution towards smaller semimajor axes.
For each comet from the sample, we determined its osculating nominal orbit (gravitational or NG if possible; see next section) based on the astrometric data, selected and weighted according to the methods described in great detail in Paper I (see also Section 2.1). This allows us to construct a homogeneous sample of cometary osculating orbits, which are the starting point for us to obtain the original and future orbits with their uncertainties and then to study cometary dynamical evolution under Galactic tides.
Our set of large-perihelion LPC orbits with 1/aori < 10−4 AU−1 contains only one comet with a slightly negative value of 1/aori, namely C/1978 G2. The MWC08 attributes original hyperbolic orbits to three more comets: C/1942 C2, C/2002 R3 and C/2005 B1. The first was discovered before 1970, therefore it was excluded from our sample. In the present paper, the orbits of the two other comets are determined based on a significantly longer interval of observations than in MWC08, and now their original (gravitational) orbits derived by us are elliptical. Later in this paper, it is shown that comet C/1978 G2 may also be of local origin. Therefore, we call this sample the large-perihelion-distance Oort-spike comets. For comets with small perihelion distances we have an essentially different situation. In MWC08 nearly 20 comets with q < 3.0 AU have negative values of 1/aori (see Fig. 1a). It turns out that for these comets the role of NG effects is important in the process of determining their osculating orbits: most small-perihelion comets on hyperbolic original orbits in the gravitational case have elliptical original orbits when the NG forces are taken into account (see next section). Observed perihelion-distance and ecliptic-inclination distributions of all investigated comets are also shown and discussed in Section 4.1.
Table 1. Original and future semimajor axes derived from pure gravitational nominal solutions (columns 3–4) and NG nominal solutions (columns 5–6) for 15 large perihelion distance comets with detectable NG effects; the number of NG parameters determined for NG solutions is given in column 11. The rms values and number of residuals are given in columns 7–8 and 9–10, respectively. The numbering in column 1 is consistent with the chronology of the discovery of all 64 considered comets. The solutions for comets C/1997 BA6, C/1997 J2, C/1999 Y1 and C/2000 SV74 are taken from Paper I.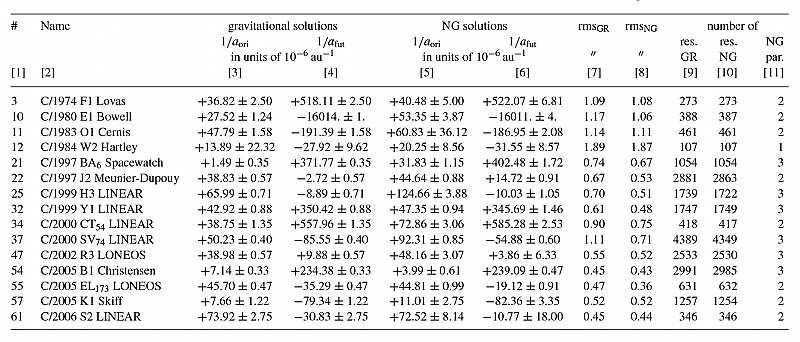
2.1 DETECTION OF NON-GRAVITATIONAL FORCES IN LARGE PERIHELION DISTANCE LONG-PERIOD COMETS
It is well-known that the actual motion of a comet is not purely gravitational (hereafter GR). This means that very small uncertainties in the orbital elements of a GR model are often only the formal errors calculated in the process of orbit determination. These small uncertainties may mislead us to believe that we know the true orbit of a comet almost perfectly. When incorporating NG effects into a dynamical model, one often obtains slightly larger formal uncertainties. However, in our opinion the resulting orbit better represents the actual cometary motion, especially when extrapolating out of the observed time interval. In particular, this may be the case of some near-parabolic orbits, where taking into account NG effects may even lead to changes in the shape of the original barycentric orbit from hyperbolic to elliptical (Królikowska 2001, 2006, and fig. 5 in Paper I). It has been shown that almost all comets with hyperbolic original GR orbits have elliptical original NG orbits.
In Paper I, our sample of comets with NG effects was composed of objects with NG orbits characterized by a clear decrease in root-mean-square error (rms) compared with the rms for purely gravitational orbits. We have found 26 comets with NG orbits very well determined, for which the original reciprocals of semimajor axes in the NG model, 1/aori,NG, were located within the range 0– 100 × 10-6 AU 1. That sample of NG Oort-spike comets contained only four objects with perihelion distances exceeding 3 AU. When the sample was constructed, many comets of a purely GR orbit inside the Oort spike were excluded because their NG orbit gave 1/aori,NG > 100 × 10-6 AU-1.
Table 2. The past distributions of swarms of VCs in terms of returning [R] or escaping [E], including hyperbolic [H] VC numbers for dynamically old comets. Aphelion and perihelion distances are described either by a mean value for the normal distributions or by three deciles at 10, 50 (i.e. median) and 90 per cent. In the case of a mixed swarm, the mean values or deciles of Q and q are given for the returning part of the VC swarm, where an escape limit of 120 000 AU was generally used. The ‘a’ superscript in columns 5–7 means that this part of mixed swarm includes the nominal orbit. For comparison we included the osculating perihelion distance in the third column; in the fourth column the Galactic latitude of the perihelion direction is given. The last two columns present the value of 1/aori and the percentage of VCs that we can call dynamically new, based on previous q statistics. Comets with NG effects are indicated by a ‘NG’ superscript located behind the comet designation (column 2).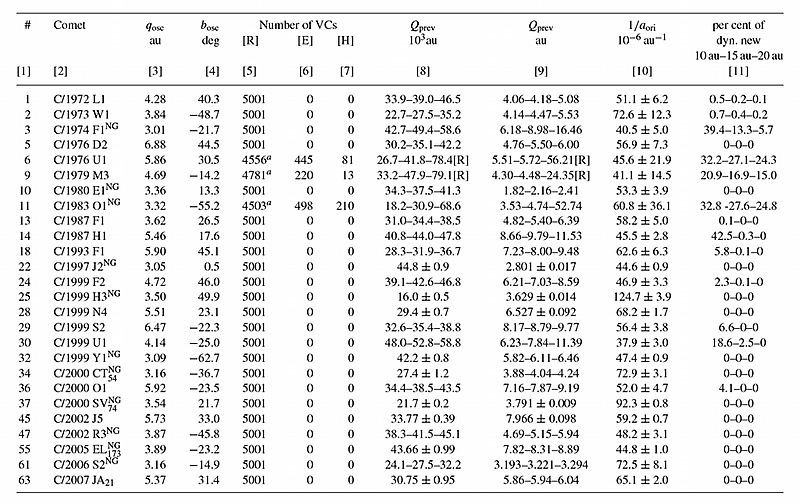
In the present study we approach the issue differently. Emphasis is laid on the completeness of the sample. This allowed us not only to investigate the dynamical behaviour in previous and future perihelions but also to make a statistical analysis of the observed sample of Oort-spike comets and their apparent source region. Knowing that NG effects in the motion of LPCs are hard to determine, we concentrated on a sample of comets with large perihelion distances in order to keep the highest possible orbit reliability even for objects with indeterminable NG effects.
However, we have not given up on determining the NG effects in these comets. For comets with large perihelion distances, the determination of NG effects is even more difficult than for comets approaching closer to the Sun. Therefore, we decided to set out the NG orbit regardless of whether it is a significant drop in rms. We assumed that even if this decrease is negligible, the model of NG motion should give a better representation of the actual cometary orbit and its uncertainty (the NG model contains one to four additional parameters, so the uncertainties of orbital elements can be significantly larger). If we were able to determine the NG parameters with reasonable accuracy,we recognized such a model as more realistic than the purely GR model. The obtained NG models were also reviewed for O–C (observed minus calculated) time variations and O–C distributions (a more detailed description of the methods used is given in Paper I). In this way, from the sample of 64 comets we determined NG orbits for 15 objects with perihelion distances greater than 3.0 AU. It appeared that all of them have q ≤ 4 AU. The comparison between GR and NG solutions for these 15 comets is given in Table 1, where comets are ordered by discovery date. Four comets from Paper I with very well-determined NG effects are included here. In our sample, we have 23 objects with perihelion distance in the range 3.0 < q < 4.0 AU (also see Table 7).This means that only eight comets in this perihelion-distance range still seem to have undetectable NG effects. Thus, clearly more than a half of all comets with perihelion distances between 3 and 4 AU (discovered after 1970) shows small deviations from purely gravitational motion, which are detectable either through a decrease in rms for NG models of motion or by improvements when analysing the differences in O−C distribution and/or O−C time variations between GR and NG models.
To determine the NG cometary orbit, we used the same formalism as in Paper I, which was originally proposed by Marsden, Sekanina & Yeomans (1973). This formalism introduces three orbital components of the NG acceleration (A1,A2, and A3, i.e. radial, transverse and normal components, respectively) acting on a comet in a case of sublimation symmetric relative to perihelion. The asymmetric NG model introduces an additional parameter τ , the time displacement of the maximum of g[r(t − τ )]. From orbital calculations, the NG parameters A1,A2, and A3 and eventually τ should be derived together with six Keplerian orbital elements within a given observational time interval (more details are given in Królikowska 2006). We know that the standard g(r) function used by us has been obtained by Marsden et al. (1973) phenomenologically on the basis of water sublimation, so we have tried to determine the NG orbits for the investigated comets assuming a more general form of g(r)-like function (see Królikowska 2004). However, it appeared that the rms and O−C time variations were practically the same and we came to the conclusion that it is better to use the standard form of the g(r) function. Our past experience in determining the NG orbit on the basis of various g(r)-like functions (Królikowska 2004) justifies such an approach. For six comets studied here we were able to derive all three parameters of the NG acceleration, for the next eight the radial and the transverse components of the NG acceleration and in one case (C/1984 W2) only the radial term.
Table 3. The past motion of dynamically new comets. The table is organized in the same manner as Table 2. In the case of a mixed swarm, the mean values or deciles of Q and q are given for the returning part of the VC swarm, where the escape limit of 120 000 AU was generally adopted, with the exception of four objects marked with one asterisk (C/2001 C1 and C/2004 X3) or two asterisks (C/2001 K5 and C/2003 G1), where escape limits of 140 000 and 200 000 AU, respectively, were applied.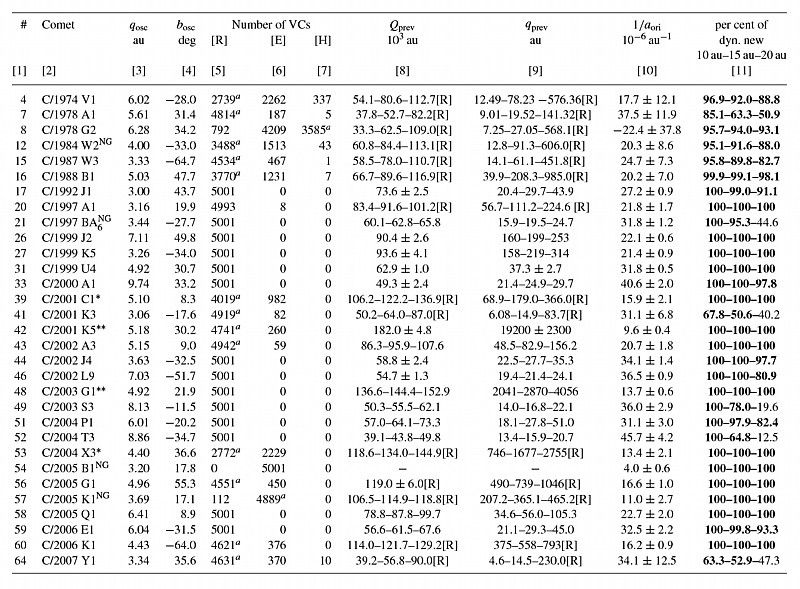
2.2 ORIGINAL AND FUTURE ORBITS. CREATING SWARMS OF VIRTUAL COMETS.
The very first step in investigating past and future motion of LPCs is to determine their original and future orbits. As usual, we call an orbit original when traced back out of reach of planetary perturbations (assumed in this paper to happen at 250 AU from the Sun). Similarly, the future orbit can be obtained after following the motion of a comet in time until it reaches the same heliocentric distance of 250 AU.
To derive original and future orbital parameters (including semimajor axes) as well as their uncertainties, we have examined the evolution of thousands of virtual comet (VC) orbits using Sitarski’s method of random orbit selection (Sitarski 1998); more details are given in Paper I. With this method we construct osculating swarms of comets that follow the normal distribution in the space of orbital elements and eventually NG parameters (the 6–9 dimensional normal statistics). Similarly to Paper I, we fill a confidence region with 5000 VCs for each nominal solution (GR and NG if determined).
Next, each VC from the osculating swarm has been numerically propagated from its position at the osculation epoch backward and forward until this individual VC reaches a distance of 250 AU from the Sun. The equations of the comet’s motion have been integrated numerically using the recurrent power-series method (Sitarski 1989, 2002), taking into account perturbations by all the planets and including relativistic effects. In this way we were able to obtain the nominal original and future barycentric orbits of each comet as well as the uncertainties in the derived values of orbital elements by fitting a normal distribution to each original and future cometary swarm (Królikowska 2001). Obtained original and future reciprocals of semimajor axes with their uncertainties are given in Tables 2, 4, 5 and 6, where comets are ordered by discovery date. As was mentioned before, only one comet in the investigated sample, C/1978 G2, formally has a negative 1/aori, but the large uncertainty in this value clearly does not exclude a Solar-system origin for this comet.
The original and future swarms of VCs become the starting data with which to study the dynamical evolution of each individual comet under Galactic tides (Section 3).
Table 4. The past motion of 7 comets with uncertain new/old status. The table is organized in the same manner as Table 2. In the case of a mixed swarm, the mean values or deciles of Q and q are given for the returning part of the VC swarm. An escape limit of 120 000 AU was used for all these comets.
2.3 DIFFERENCES BETWEEN NON-GRAVITATIONAL AND GRAVITATIONAL MODELS
For the 15 comets with determined NG orbits, we present only the results for the dynamic evolution of NG swarms of VCs (Tables 2 and 6 ). However, we also derived their original and future orbits starting from the GR osculating orbits. Differences between the GR and NG results will be discussed in terms of differences in values of 1/aori and 1/afut and possible differences in the assessment of the dynamical status of investigated comets (Section 4). In this section we focus on the first issue.
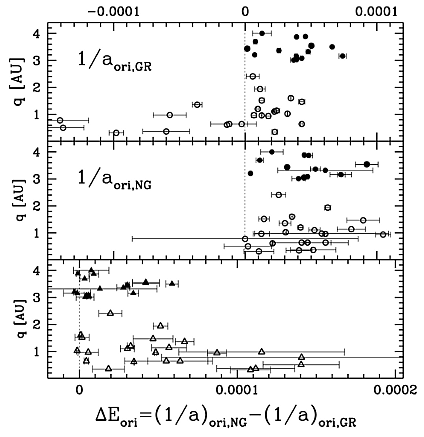
Fig. 2 shows the differences between the original reciprocals of semimajor axes for GR and NG models. Comets investigated here are represented by filled symbols (15 comets with q ≥ 3.0 AU), while the open symbols represent 22 comets with q < 3.0 AU from Paper I. When formulating a conclusion, one should remember that the comet sample analysed in Paper I was constructed on different principles from the sample of comets currently being examined. However, Fig. 2 clearly shows that in the case of comets with low q (less than, say, q ≤ 2 AU) the differences Δ(1/aori) = 1/aori,NG - 1/aori,GR are typically much greater than for comets with large q (q greater than 3 AU). For more than 50% of large-perihelion comets, Δ(1/aori) < 20 × 10−6 AU−1. It is worth noting that, of the 15 comets with 1/aori,GR inside the Oort spike, only one has an NG orbit slightly outside the peak (C/1999 H3, 1/aori,NG = (124.66 ± 3.88) × 10−6 AU−1). Constructing the sample of NG Oort-spike comets (see Paper I), we obtained several such cases.
Usually the uncertainties of orbital elements, including the original and future semimajor axes, are larger for NG orbits than for GR orbits. Thus, initial NG swarms of VCs for original and future orbit calculations are more dispersed than GR swarms. In our opinion, the NG swarms of VCs better reflect our actual knowledge of studied cometary orbits. This affects the determination of the 1/aori,NG uncertainty, which is generally a factor of 2–3 larger than the uncertainty in the 1/aori,GR determination for the same comet, as can be observed in Table 1. An extreme case is 1/aori,NG = (60.8 ± 36.1) × 10−6 AU−1 for comet C/1983 O1, while the purely GR swarm gives 1/aori,GR = (47.8 ± 1.6) × 10−6 AU−1, which is a solution formally more than one order of magnitude more accurate.
For the remaining 49 comets, NG effects are indeterminable. Hence, we present the results for purely gravitational swarms of VCs. However, only eight of these comets have perihelion distances less than 4 AU. With the apparent trend of significant reduction of differences between the NG and GR orbits with increasing perihelion distance ( Fig. 2), it seems reasonable that the vast majority of the actual orbits of these 49 comets are well-targeted despite omitting NG effects.
Table 5. The future distributions of the returning and mixed swarms of VCs in terms of returning [R] and escaping [E], including hyperbolic [H] VC numbers. Aphelion and perihelion distances are described either by a mean value for the normal distributions or by three deciles at 10, 50 (i.e. median) and 90 per cent. In the case of a mixed swarm, the mean values or deciles of Q and q are given for the returning part of the VC swarm, where an escape limit of 120 000 AU was generally adopted. The one exception is comet C/2002 J5, marked with an asterisk, where an escape limit of 140 000 AU was applied. The ‘a’ superscript in columns 4–5 means that this part of the mixed swarm includes the nominal orbit. The last column presents the value of 1/afut.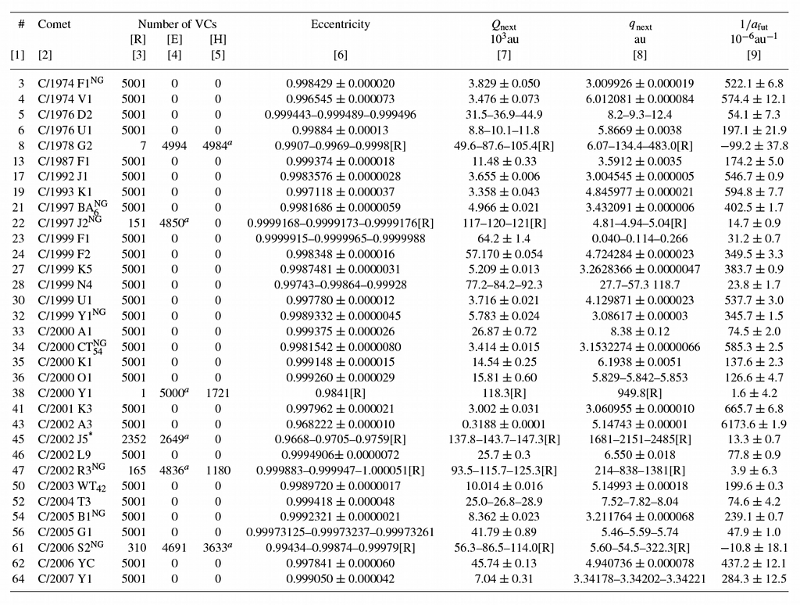
3 PREVIOUS AND NEXT PERIHELION PASSAGES
Starting from original or future LPC orbits, we followed the dynamical evolution under Galactic tides, where both disc and central terms were included. This is possible only in the absence of any other perturbing forces. Dybczyński (2006) has shown that none of the known stars influenced the motion of LPCs significantly in the last say 10 million years, and the same holds for an analogous interval in the future. Similar conclusions may be found in Delsemme (1987), Matese & Whitman (1992),Wiegert & Tremaine (1999), Dybczyński (2002), Matese & Lissauer (2004), Emel’yanenko, Asher & Bailey (2007) or most recently Kaib & Quinn (2009). A ten million year interval is comparable with the orbital period of a comet having a semimajor axis of 50 000 AU, so therefore we decided to follow the motion of each comet for one orbital period to the past and future. Additionally, longer numerical integrations would show rather artificial cometary motion in the case of previous/next perihelion passage inside the planetary region, since planetary perturbations cannot be taken into account for obvious reasons. More discussion of the influence of omitting stellar perturbations on presented results may be found in Section 5. In the way described above, we obtain the previous and next perihelion passage distances or detect past or future escape; see Table 7. We call the final orbits obtained from these calculations previous and next, respectively.
In this paper we refer to a comet (or more precisely each individual VC) as returning [R] if it goes no further than 120 000 AU from the Sun. All other comets (or VCs) are called escaping [E], but among them we count escapes in hyperbolic [H] orbits. For two comets in our sample, namely C/2001 C1 and C/2004 X3, we decided to increase the threshold value up to 140 000 AU, because the medians of aphelia of their orbits were slightly below this value (both are marked with an asterisk (*) in Table 3). For the past motion of the next two comets, C/2001 K5 and C/2003 G1, we present the results for the escape limit of 200 000 AU; they are marked with two asterisks (**) in Table 3. For such a huge threshold value, all VCs of these comets are returning and we are able to present a more reliable description of the previous perihelion distance than for the standard threshold, where we are restricted to the synchronous variant (see below) because all VCs are escaping. The classification of these four comets as dynamically new is by no means influenced by these escape border extensions, due to very large previous perihelion distances of all of them.
For a detailed description of the dynamical model as well as its numerical treatment the reader is kindly directed to Paper I. Based on the conclusions from that work, we used both Galactic disc and Galactic centre terms in all calculations. For comparison with Paper I, all the parameters of the Galactic gravity field are kept unchanged, including the local disc mass density, ρ =0.100 M⊙pc-3.
Table 6. The future distributions of comets with fully hyperbolic [H] swarms of VCs. Comets with NG effects are indicated by a ‘NG’ superscript located behind the comet designation (column 2). In column 6 the eccentricity distribution at 120 000 AU is described either by a mean value for the normal distributions or by three deciles at 10, 50 and 90 per cent. The last column presents the value of 1/afut.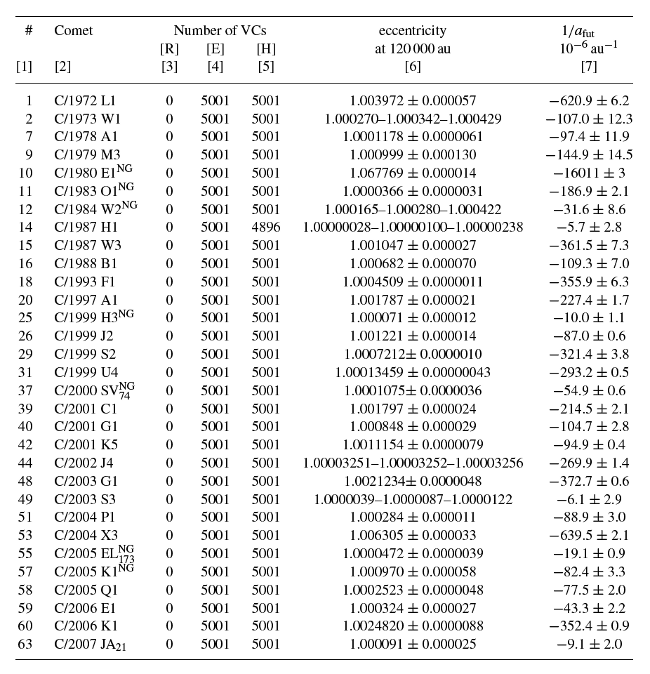
The rules of stopping the numerical integration were as follows: if all VCs for a particular comet were returning, all of them were stopped at individual previous/next perihelia. There was also a synchronous variant, in which all VCs were stopped simultaneously when the nominal VC reached previous/next perihelion. When all VCs were escaping, the calculation was always terminated synchronously when the fastest VC crossed the escape limit, usually equal to 120 000 AU. If for a particular comet the swarm of VCs consists of both returning and escaping VCs, the returning part was stopped at previous/next VC perihelia and the rest (escaping ones) when the fastest escaping VC crossed the escape limit. For these mixed swarms we also performed a synchronous variant, in which all VCs (both returning and escaping) were halted when the fastest VC crossed the escape limit.
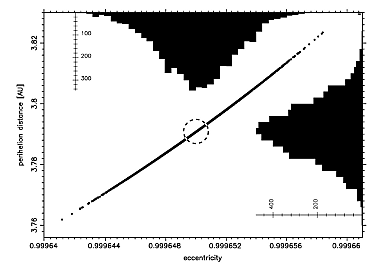
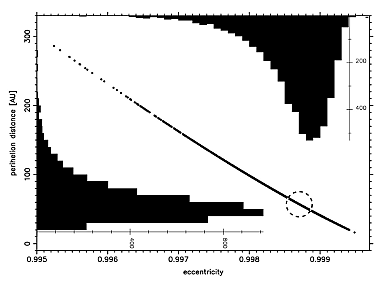
In Tables 2, 3 and 4, in columns 8 and 9 we presented previous aphelion and perihelion distances, respectively. In Table 5, analogous data for comets returning in the future are given in columns 7 and 8. Depending on the distribution characteristics, we use two different methods of aphelion and perihelion distance presentation: if the distribution can be reliably approximated with a Gaussian one, we present the estimated mean value and its standard deviation. An example of a Gaussian distribution of past elements may be found in Fig. 3. In the case of a highly deformed distribution, we present three deciles: 10th, median and 90th. An example of a non-Gaussian distribution of past elements may be found in Fig. 4.
3.1 OVERALL STATISTICS
For the past motion we obtained 42 comets with all VCs returning, 19 comets with mixed VC swarms and only thee comets fully escaping (but with all VCs on highly eccentric elliptical orbits). For the statistics presented in this section, the standard escape limit of 120 000 AU for all investigated comets was used. Almost all 19 comets with mixed VC swarms have a majority of returning clones; only two swarms consist mainly of escaping VCs (C/2005 K1 and C/1978 G2, the latter is the only one with a nominal hyperbolic original orbit).
In total, for the past motion of studied comets we obtained 275 042 returning VCs (87.3%) out of a total of 315 063 starting from the Oort spike (outside the Oort spike was the NG swarm of C/1999 H3). Statistics of previous perihelion and aphelion distributions for all these returning VCs are shown in Table 7. It should be stressed, however, that we call ‘escaping’ all VCs moving further than 120 000 AU from the Sun. This is motivated by the fact that, because of a large heliocentric distance and huge orbital period, these VCs may have their orbits modified by (even weak) stellar perturbations in the past (or future). The only possibility is to state that with our current knowledge their dynamical history seems impossible to reveal. However, one should not interpret these comets as of interstellar origin. The vast majority of the VCs escaping in the past still move in elliptical, heliocentric orbits and we have no direct evidence that they were not Solar-system members. See Section 3.2 for a detailed analysis of some particular examples.
It is widely known that the situation concerning the future motion is quite different. In Paper I the great majority of the 22 investigated comets with q < 3.0 AU (about 77%) were ejected from the Solar system by planetary perturbations. In the present sample of 64 comets, this percentage is significantly smaller: 33 comets (about 52%) are ejected in the future, two comets from Table 5 (see below) and all from Table 6.
We obtained 31 comets with all VCs escaping in the future on hyperbolic orbits (with the exception of a small part of the VC swarm of C/1987 H1 escaping on extremely eccentric elliptical orbits). We also obtained 27 comets fully returning in the future and only 6 comets with mixed swarms. All these mixed swarms mainly consist of escaping VCs; the nominal VCs of two comets have hyperbolic future orbits. Thus, it seems probable that these two comets (C/1978 G2 and C/2006 S2, see Table 5) are also escaping from the Solar system. In the case of two comets with mixed future swarms (but without any hyperbolic VCs, namely C/1997 J2 and C/2002 J5) it is possible to obtain a fully returning future swarm by applying an escape threshold enlarged up to 200 000 AU. For C/2002 J5 this is illustrated in Fig. 5, where we present the heliocentric distance changes of all VCs representing C/2002 J5, for one orbital period both to the past and to the future. In contrast to Fig. 6, the past VC swarm is very tight here and the future swarm, while crossing the standard escape border of 120 000 AU, is all returning, having a future perihelion distance greater than 2500 AU.
For the future motion, we have in total 135 661 (43.1%) returning VCs and their statistics are presented in the lower part of
Table 7.
Table 7. Overall VC distributions for previous and next perihelion passage (based on a standard escape limit of 120 000 AU) for all investigated comets except '''C/1999 H3, see text.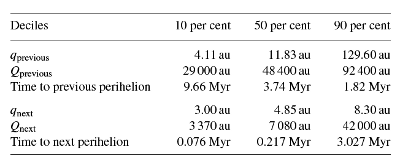
3.2 COMETS WITH EXTREMELY LARGE SEMIMAJOR AXES IN THE PAST
In our sample, we have six comets with extremely large original semimajor axes (1/aori < 15 × 10-6AU-1). Three of them, C/2001 K5, C/2003 G1 and C/2005 B1, have well-determined 1/aori and completely escaping swarms of VCs for the standard escape limit of 120 000 AU used in this paper. The first two have a similar osculating perihelion distance of about 5 AU and very similar behaviour in the past. It can be seen from Table 3 that a swarm of C/2003 G1 is completely returning for an escape limit shifted to 200 000 AU with a previous perihelion of about a few thousand AU from the Sun. The same is true in the case of comet C/2001 K5 for a slightly larger escape border, but in this case the previous perihelion distance is almost one order greater. This rather suggests that both are Solar system members, but due to their large semimajor axes and long orbital periods we cannot exclude that their past motion was disturbed by stellar perturbations and as a result their dynamical history was quite different.
The third comet with a completely escaping past swarm, C/2005 B1, formally has a semimajor axis of about 250 000 ± 50 000 au! This comet is also unique in the sense that NG effects determined for this comet caused elongation rather than shortening of its NG original semimajor axis relative to the GR solution (see Section 2.1 and Fig. 2), however the difference between NG and GR models is small: Δ(1/aori) = 1/aori,NG - 1/aori,GR = (−3.2 ± 0.9) × 10-6AU-1. Taking all this into account, comet C/2005 B1 seems to be unique and we cannot even rule out its interstellar origin. It seems worth mentioning that this comet is the only one of the six comets considered in this section that is returning in the future.
The remaining three comets with extremely large past semimajor axes are C/1978 G2, C/2004 X3 and C/2005 K1. All three have mixed past swarms of VCs, but while C/2005 K1 and C/2004 X3 have all VCs in elliptical orbits, the majority of VCs representing C/1978 G2 are hyperbolic. However it must be noted that C/1978 G2 has a poorly determined orbit. In fact, it is the worst determined orbit throughout our sample, which comes from an extremely small number of observations – we have only 7 positions of that comet. As a result, its past swarm of VCs is very dispersed. Nevertheless, it is the only comet in our sample with 1/aori formally negative. Having 72% of past VCs (including a nominal one) moving on hyperbolic orbits, this comet seems to be a candidate for an interstellar object.
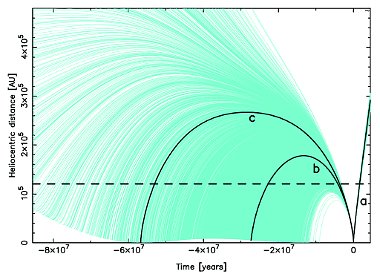
The past and future dynamical evolution of C/2005 K1 is shown in Fig. 6. We plot here the heliocentric distance of all 5001 VCs with respect to time. The zero-point on the time axis corresponds to the observed perihelion passage of this comet (2005 November 21). To obtain such a plot for this particular comet, we allowed all VCs to move as far as 500 000 AU from the Sun, which takes more than 80 million years for some of them. Even such an extremely distant escape limit is not sufficient to obtain a purely returning past swarm of VCs for this comet. While all orbits are elliptical, their high dispersion forced us to conclude that the dynamical history of C/2005 K1 cannot be determined based on available observations. In contrast, all its future VCs are ejected from the Solar system in hyperbolic orbits (nominal 1/afut = (−82.4 ± 3.3) × 10-6AU-1) without any doubt. There is an additional interesting detail in its past evolution depicted in Fig. 6. We marked with black lines the future motion of the nominal VC (a curve), the past motion of the nominal VC (b curve) and the past motion of one additional VC (c curve), which represents an interesting dynamical scenario. Its orbital period is equal to the period of long-term perihelion distance changes due to Galactic tides. As a result, its previous perihelion distance can be arbitrarily small. However, because it takes some 57 million years to reach previous perihelion for this VC, one should treat this scenario as rather questionable due to potential stellar perturbations suffered by it during such a long time interval. The past evolution of the VC swarm of C/2004 X3 is much more tight than that of comets C/1978 G2 and C/2005 K1. However, to obtain the majority of clones coming back it was necessary to shift the escape limit to 140 000 AU (see Table 3) and only an unrealistically large escape limit of 260 000 AU gives a whole VC swarm returning.
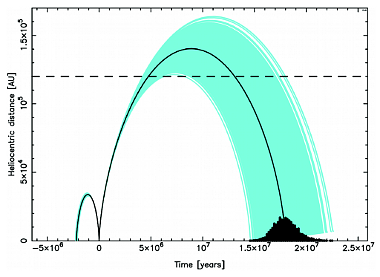
Fig. 5. Past and future heliocentric distance changes of all VCs representing C/2002 J5. Grey (cyan) lines present heliocentric distance changes of all VCs except the nominal ones, for which a black line is used. Additionaly the distribution of the future VC swarm (black histogram) in time is presented.
Table 8. Comets with a previous perihelion distance smaller than the observed one. This means that they were observed after the minimum point in the Galactic evolution of the perihelion distance; see also Fig. 15. In column 5 the statistics of perihelion distance changes of all VCs during the last orbital revolution are represented by three deciles, and the percentage of negative Δq is given in column 6. Since changes in q are highly correlated with the Galactic argument of perihelion ω, its evolution is also shown in columns 7 and 8, as well as the latitude of the perihelion direction bori . For comparison the previous perihelion distance in the Galactic-tide disc model only is given in parentheses in the third column.
3.3 SMALL PREVIOUS PERIHELION DISTANCES
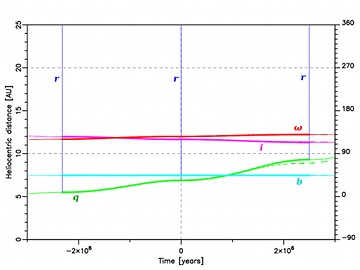
In the light of the Jupiter–Saturn barrier concept, one should expect that most of the observed Oort-spike comets should have a previous perihelion distance well out of the reach of planetary perturbations. This is not the case. In the sample of 22 small-perihelion comets (qosc < 3.0 AU) investigated in Paper I, we obtained previous perihelion distances qprev < 15 AU for 15 comets (almost 70%). Now, in the sample of 64 LPCs with qosc > 3 AU we have obtained a significantly smaller fraction of such comets, but still almost 50% of the sample have a previous perihelion distance smaller than 15 AU. Moreover, among them, six comets (C/1972 L1, C/1976 D2, C/1976 U1, C/1979 M3, C/1980 E1 and C/1997 J2) have a previous perihelion distance smaller than the osculating one (see Table 8)! The percentage of comets investigated in Paper I that were observed at a greater perihelion distance than their previous perihelion distance is roughly the same, but the q changes for small-perihelion comets are smaller, below 0.3 AU. It should be stressed here that observing LPCs during the increasing phase of their perihelion-distance evolution is direct evidence that their dynamical history followed one of two possibilities: either they were strongly perturbed by planets during their previous perihelion passage (which switched the phase of the perihelion-distance evolution) or they have moved unperturbed through the Jupiter–Saturn barrier in the past. Of these six comets, C/1976 D2 suffered practically no planetary perturbations in the observed perihelion passage (see Fig. 7). These comets can also be found in the very bottom part of Fig. 15(b); some theoretical interpretation of their apparent distribution is given in Section 4.3.
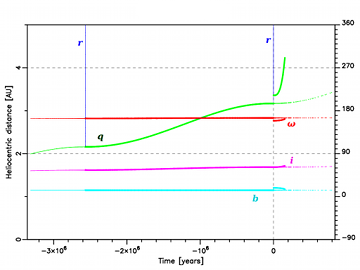
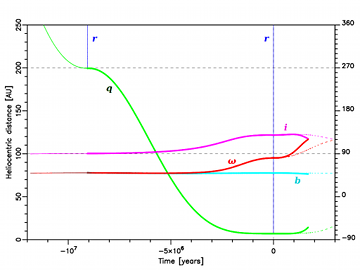
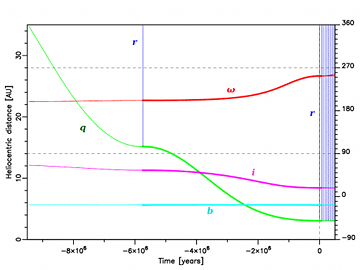
An example of smaller previous perihelion distance is depicted in Fig. 8, where the past and future dynamical evolution of C/1980 E1 is illustrated by the evolution of orbital elements of its nominal VC. As for any other VC, we followed its motion numerically under the influence of Galactic perturbation. Since we present several similar plots, we describe this here in more detail. For the past motion, we started from the original orbit but for the future motion from the future orbit; both were obtained with NG effects included in this specific case. See Section 2.1 for additional information. The horizontal axis shows the moment of osculation for which orbital elements are calculated and plotted; the zero-point corresponds to the observed perihelion passage. The left vertical axis is expressed in AU and describes both the heliocentric distance of a VC (r, thin vertical blue lines) and its perihelion distance (q, continuous, green line). The right vertical axis describes angular elements (calculated in the Galactic frame) and is expressed in degrees. We plot here the synchronous evolution of the argument of perihelion (ω, red line), inclination (i, magenta line) and the Galactic latitude of perihelion (b, cyan line). The thick lines depict the real dynamical VC evolution while their continuation with thin lines depicts potential motion in the absence of planetary perturbations in the previous/next perihelion. Dotted/dashed lines right from the zero-point describe additionally an artificial variant of the future motion, in the absence of all planetary perturbations during the observed perihelion passage. The noticeable discontinuities of the thick lines at the zero-point of the time axis are the result of a close encounter of C/1980 E1 with Jupiter (Δ = 0.228 AU, 1980 December 9.46).
The original perihelion distance of C/1980 E1 is qori = 3.17 AU, while the previous one (almost 2.6 million years ago) is qprev = 2.16 AU. It should be noted that at previous perihelion passage C/1980 E1 was perturbed by planets, possibly rather strongly due to its small previous perihelion distance. Since it is impossible to calculate this perturbation (due to large uncertainties in planetary positions 2.6 million years ago), one should treat the orbital element evolution left from the previous perihelion passage as likely to be completely fictitious, so we have shown it using thin lines. The largest perihelion distance increase can be found for C/1976 D2, where the observed value was 6.88 AU but the previous one 5.50 AU (see Table 8). This comet also provides clear evidence that penetration through the Jupiter–Saturn barrier can be observed. Planetary perturbations in this case were very weak, slightly decreasing its inverse semimajor axis from 1/aori = (56.9 ± 7.3) × 10-6AU-1 to 1/afut = (54.1 ± 7.3) × 10-6AU-1. This almost unperturbed motion through perihelion is depicted in Fig. 7. In fact, this comet is ‘double evidence’. First, we observed it at a larger perihelion distance than the previous one, with all the consequences described above. Second, the observed perihelion passage demonstrated an unperturbed motion through the Solar system and its next perihelion distance is even larger, although still observable! This is discussed in more detail in the next section.
3.4 SMALL NEXT PERIHELION PASSAGE DISTANCES
While the Jupiter–Saturn barrier mechanism predicts that great majority of all LPCs that approach the Sun closer than 10 - 15 AU should definitely be removed from this population, we observe that over 40% of our sample (26 comets) will keep moving on typical LPC orbits with small (q < 10 AU) next perihelion passage distances. Moreover, six of them remain members of the Oort spike (1/afut < 10-4 AU). These comets (C/1976 D2,C/1999 F1,C/2000 A1, C/2002 L9, C/2004 T3 andC/2005 G1) constitute important, direct evidence that about 10% of large perihelion distance Oort-spike comets can move directly through the Jupiter–Saturn barrier and remain observable. It is worth mentioning that for a hypothetical observer of such comets during their next perihelion passage, they could potentially be interpreted (probably incorrectly) as a result of the Kaib & Quinn (2009) scenario discussed in Section 4.4. Three of them have their semimajor axes significantly shortened, which makes the perihelion-distance evolution under Galactic tides much slower. An impressive example of very small next perihelion distance is the case of C/1999 F1; see Fig. 9. The previous perihelion distance of this comet was 12.1 ± 0.48 AU, the observed one 5.79 AU but the next with high certainty will be smaller than 0.3 AU! In contrast to the most probable scenario attributed to the Jupiter–Saturn barrier crosser, the semimajor axis of this comet was slightly increased due to planetary perturbations (the same happened to C/1976 D2) and as a result the next perihelion passage will be closer to the Sun than in the absence of planets. Typical planetary perturbations here are very small. In Paper I we obtained only nine returning comets for the future motion (from the sample of 22 comets), but all of them have perihelia inside the observable zone.
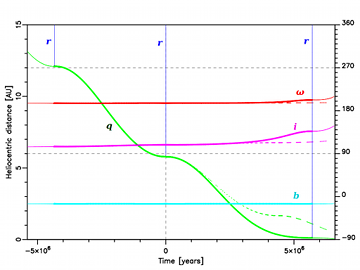
Fig. 9. Past and future orbital evolution of the nominal VC for C/1999 F1; see text for a detailed description. Another example of an Oort-spike comet moving through the Jupiter–Saturn barrier and remaining an observable LPC. 50% of VCs representing this comet will have next perihelion distance smaller than 0.012 AU and 90% smaller than 0.27 AU.
3.5 COMETS WITH NEXT SEMIMAJOR AXIS BELOW 2000 AU
According to the presented analysis, about 12% (8 objects) of observed large perihelion Oort-spike comets return in orbits similar to that of comet C/1996 B2 Hyakutake (1/afut = 554 × 10-6AU-1), however that comet had an original orbit more tightly bound than the future orbit. Six of these comets create a noticeable local maximum in the 1/afut distribution displayed in Fig. 12. This maximum consists of two dynamically new comets, three dynamically old comets and one with an uncertain past dynamical status (see the definitions in Section 4.1). Three of these objects have qosc < 3.5 AU. The shortest future orbit is for C/2002 A3, for which the future semimajor axis equals ∼162 AU. This comet will return in the next ∼1600 yr with a perihelion distance of 5.15 AU.
4 NEW AND OLD LONG-PERIOD COMETS
The terms new and old long-period comets have been widely used in the literature for many decades. Sometimes the authors add adjectives: dynamically or physically, to inform the reader which criteria they use to distinguish between new and old LPCs, but inmost cases the intention is that dynamically new should appear as physically new and vice versa. Historically, the first criterion used in this field was simply the semimajor axis value, a. The widely accepted statement was that all comets with a > 10 000 AU were dynamically new. This was used for example by Oort (1950). Just a year later, Oort & Schmidt (1951) published a paper that seems to be the source of the widely quoted and repeated opinion that new LPCs are more active and brighter. In fact, nowadays it is very difficult to prove the truth of this statement – see for example Dybczyński (2001), who collected a large number of LPC absolute magnitudes and found no correlation with their dynamical history. Dybczyński (2001) also showed that using a > 10 000 AU as the criterion for being a dynamically new LPC seems to be completely unsatisfactory. Recently, Fink (2009) presented an extended taxonomic survey of comet composition based on their spectroscopic observations. Concerning LPCs, he also did not find any correlation with the semimajor axis (see for example fig. 8 in the quoted paper).
4.1 HOW CAN WE DISTINGUISH BETWEEN OLD AND NEW?
Let us start with definitions.We use the term ‘dynamically old LPC’ for objects with previous perihelion passage distance smaller than some threshold. This threshold value should describe the sphere of significant planetary perturbations. In Paper I we used 15 AU as this limit, but now we have decided to use three different values, namely 10, 15 and 20 AU, in parallel to observe how the new/old classification depends on it for investigated comets. Because we replaced each individual comet with a swarm of 5001 VCs, we applied the above-mentioned criterion individually to each VC and then classified a particular comet depending on the percentage of escaping VCs – if more than 50% of VCs were escaping in the past we would call the parent comet a dynamically new one with respect to the particular threshold value. It is worth mentioning that except in a few cases this percentage is significantly close to zero or 100% (see column 11 in Tables 2 and 4). With this definition, a dynamically new LPC should have moved (before the observed perihelion passage) in an orbit that is free from planetary perturbations and therefore can be used to study the source region of LPCs by tracing its motion back in time under Galactic perturbations. From the point of view of the above-mentioned three different threshold values and based on their motion in the past we finally divided the whole sample of 64 comets into three groups. In the first one (see
Table 2) we placed 26 comets that are dynamically old with respect
to all three values. The second group (see Table 3) consists of 31 dynamically new comets with respect to all three values (26 comets) or only the two lower values (10 AU and 15 AU; five comets). The third one (see Table 4) groups seven comets of uncertain dynamical age: they are new if one takes 10 AU as the threshold value but old for greater threshold values.
The observed perihelion distance and ecliptic inclination distributions of all investigated comets may be found in the first rows of Tables 9 and 10. There is a clear observational selection signature in the perihelion distance distribution. The ecliptic inclination distribution presented in Table 10 is shown for two groups of comets, with q < 4.5 AU and q ≥ 4.5 AU. In the whole sample of large perihelion Oort-spike comets discovered since 1970 there are more comets moving in prograde orbits (56.2%) than in retrograde orbits (43.8%), however for the subsample of comets with 3.0 ≤ q < 4.5 AU we observe the same number of prograde and retrograde orbit comets. It means that this disproportion comes entirely from a subset of comets with q ≥ 4.5 AU, where the ratio of comets in prograde orbits to comets in retrograde orbits is about 1.6 (see Table 10).
We have also found an interesting feature in the distributions presented in Table 10. While the number of prograde and retrograde orbits of comets with 3.0 < q < 4.5 AU is equal, the proportion of dynamically new to dynamically old ones is reversed in these groups. In other words, there are about twice as many dynamically new comets on prograde orbits as on retrograde orbits (9:4) and the proportion is opposite for dynamically old comets (5:10).
A nice example of a comet that is dynamically new for sure, C/1999 J2, is presented in Fig. 10. The previous perihelion passage of the nominal orbit of this comet happened some 9 million years ago at a heliocentric distance of 200 AU (80% of its VCs have a previous perihelion distance in the interval between 160 and ∼250 AU, see Table 3).
Table 9. Observed perihelion distribution in the sample of large perihelion Oort-spike comets (for explanation of dynamically new, dynamically old and dynamically uncertain comets see Section 4).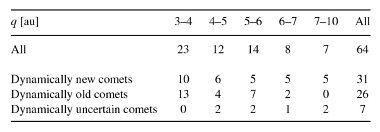
Table 10. Observed inclination distribution in the sample of large perihelion Oort-spike comets (for explanation of dynamically new, dynamically old and dynamically uncertain comets see Section 4).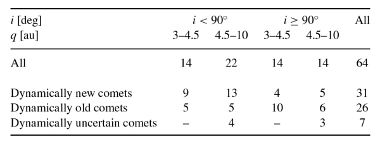
The spatial distribution of aphelion directions of all Oort-spike comets with q > 3 AU (discovered before 2009) is presented in
Fig. 11. Circles mark dynamically new comets, squares dynamically
old ones and triangles show seven comets with uncertain dynamical status, according to the definitions adopted in this section. In addition to these we included here 11 large perihelion distance comets (marked with crosses) discovered before 1970 and omitted in the present investigation. Such a spatial distribution is often used when searching for the signature of some specific perturbers; see Fernández (2011) and Matese & Whitmire (2011) for recent discussions of this subject. When looking for the effects of a massive perturber moving on a distant heliocentric orbit, one should expect a concentration of aphelia directions along some great circle in the sphere. It seems to be difficult to interpret the distribution presented in Fig. 11 in such a way.
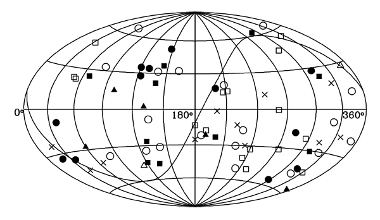
Fig. 11. This Aitoff projection sky map shows the distribution of aphelion directions for all (discovered before 2009) large perihelion distance Oort-spike comets in galactic coordinates. Squares, circles and triangles show comets investigated in this paper, where different symbols indicate dynamically old comets, dynamically new comets and comets of uncertain dynamical status, respectively; full and open markers represent comets returning and escaping in the future. Black crosses show 11 Oort-spike comets discovered before 1970.
4.2 HOW DIFFERENT ARE NEW AND OLD COMETS?
Fig. 12 shows the distribution of original and future 1/a as well as
the distribution of planetary perturbations acting on comets during
their passage through the inner Solar system (Δ(1/a) = 1/afut - 1/aori).
The white and black parts of the histograms represent dynamically
new and dynamically old comets, and grey those comets
with uncertain dynamical status in the sense described above (Section
4.1). First, we focus on the total distributions of cometary
energies (left-hand side panels). It is clear that all three distributions
visible in Fig. 12(a) show some deviations from the Gaussian
model. However, Gaussian fitting to the sample of 62 comets
(C/1978 G2 and C/1999 H3 were excluded) gives <1/aori>=(37.8
± 17.7) × 10-6AU-1 with negative kurtosis equal to −0.55.
(We use a standard definition of the kurtosis: K = (μ4/σ4)−3, where μ4
is the fourth central moment, σ is the standard deviation.)
Generally the 1/aori distribution has a wider and lower peak around
the mean value than a normally distributed variable. Outside the
horizontal scales of the middle and lowest panels are two comets
that have suffered large planetary perturbations during their passage
through the inner Solar system: C/1980 E1 Bowell (Δ(1/a) =
= -16064 × 10-6AU-1, mainly due to a Jupiter encounter within
0.228 AU on 1980 December) and C/2002 A3 LINEAR (Δ(1/a) = +6153 × 10-6AU-1, mainly due to a Jupiter encounter within 0.502 AU on 2003 January). Planetary perturbations acting on the
sample of these large perihelion comets show a clear asymmetry
relative to zero (see lower panel), with a negative median value of
Δ(1/a) = -51.8 × 10⁻⁶AU-1, whereas the distribution of 1/afut
is more symmetric relative to zero (the middle panel), with a median
value of -6 × 10⁻⁶AU-1. A statistical analysis shows that
the Δ(1/a) distribution is closest to the Gaussian distribution. We
estimated the value of mean planetary perturbations (represented
by the standard deviation of the Δ(1/a) distribution) to be equal
to 285 × 10-6AU-1 by fitting to the Gaussian distribution, however
the Δ(1/a) distribution has non-zero kurtosis (0.201) and is asymmetric
with a longer right tail (skewness equal to 0.237). The obtained
mean planetary perturbation in comet energy is significantly
smaller than predicted by numerical simulations (Fernández 1981;
Duncan, Quinn & Tremaine 1987). This is probably the result of
the non-uniform inclination distribution in the observed sample of
large perihelion comets (see Table 10), in contrast to the quoted
simulations. With a relatively large number of high-inclination
and retrograde orbits, the mean energy change is expected to be
smaller.
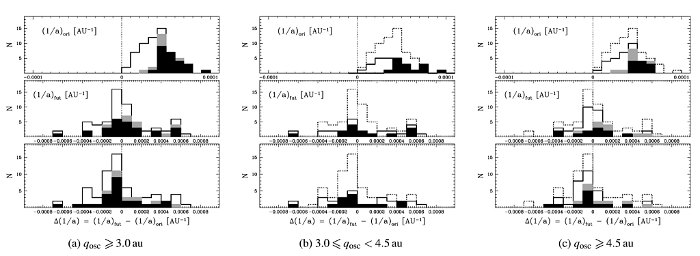
Fig. 12. Distributions of original and future cometary energies measured by 1/aori (top panels) and 1/afut (middle panels) for the observed sample of large perihelion Oort-spike comets. The bottom panels represent the distribution of planetary perturbations acting on comets during their passage through the planetary system (Δ(1/a) = 1/afut − 1/aori). The filled parts of the histograms represent dynamically old comets and grey the seven comets with uncertain dynamical status, i.e. comets not dynamically new for a limit of 15 AU for previous perihelion distance but dynamically new for a limit of 10 AU. Dotted histograms in the middle and right-hand panels ((b) and (c)) represent the total histograms of the 64 comets from left-hand panel (a).
The future 1/a distribution seems to have a second small maximum in the interval 500×10−6 <1/afut <600×10−6 AU−1 (middle panel of Fig. 12). This maximum consists of six comets (C/1974 F1, C/1974 V1, C/1992 J1, C/1993 K1, C/1999 U1 and C/2000 CT54), of which three have qosc < 3.5 AU. The separate 1/a distributions of comets with moderately large q (3.0 ≤ qosc < 4.5 AU) and very large q ( qosc > 4.5 au) are shown in panels (b) and (c) of Fig. 12, where the contributions of all three dynamical groups of comets to original and future 1/a distributions as well as to Δ(1/a) distributions are presented. Both distributions of original 1/a are noticeably different. The 1/aori distribution of comets with very large q is more compact, with a clear maximum around 1/aori ∼ 40–50 × 10-6AU-1, whereas the distribution of comets with moderately large q is more flattened and its maximum is located somewhere in range 30–40 × 10-6AU-1. An additional difference is reflected in the absence of very large perihelion comets with 1/aori > 70 × 10-6AU-1, while we have four such comets with moderate q. It may be noted that the future 1/a distribution and Δ(1/a) distribution for moderate q comets are much more flattened, while for comets with very large q we observe a clear maximum more or less around zero. Thus, we observe an excess of comets with very large q experiencing small planetary perturbations.
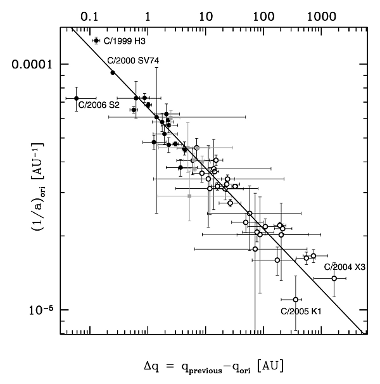
Fig. 13. Δq versus 1/aori on a logarithmic scale, derived for the observed sample of large perihelion Oort-spike comets. Open dots show dynamically new comets, filled dots dynamically old comets and grey squares the seven comets with uncertain dynamical status, i.e. comets not dynamically new for a limit of 15 AU for previous perihelion distance but dynamically new for a limit of 10 AU. The error bars for perihelion distances are described by deciles in range 10–90 per cent; the vertical error bars are described by the 1σ error for a normal distribution of 1/aori. A straight line represents the best fit to all presented points, except for Comet C/2006 S2.
Fig. 13 shows the relation between the changes in perihelion distance during the last orbital revolution and the original semimajor axes. Filled dots represent dynamically old comets, open dots dynamically new comets and grey squares the seven comets with uncertain dynamical status. Six dynamically new comets with negative Δq = qprev - qori and four dynamically new comets with escaping or almost escaping swarms are not included in this figure (see also Section 3.2), except for comet C/2005 K1, which is shown as the lowest point in the figure. The point standing off to the left of the fit line represents comet C/2006 S2. It is worth noting that comet C/1978 G2, with a formally negative 1/aori but large uncertainty in the 1/aori value, is consistent with the presented fit (the logarithmic scale in the figure makes it impossible to show). A straight line represents the best fit to 53 points from which the relation Δq ∼ (1/aori)-4.06±0.16 was derived. The obtained exponent is significantly smaller than that presented in Yabushita (1989) but remarkably closer to the expectations of first-order Galactic-disc tide theory (Byl 1986). It is still a little larger than the theoretical value, but this might be the result of including the Galactic-centre tide in our model.
4.3 EVOLUTION OF ORBITAL ELEMENTS IN THE GALACTIC FRAME
It is a well-known fact that under a separate Galactic-disc tide the secular evolution of cometary orbital elements is strictly periodic and synchronous, i.e. the minimum of the perihelion distance coincides with the minimum of the Galactic inclination, the maximum of the eccentricity and a Galactic argument of perihelion crossing 90° or 270° . The Galactic centre term introduces only a small discrepancy from this regular patterns, but even during one orbital period it can manifest itself in some specific cases. This is true especially for small (Galactic) inclination orbits and for large orbital periods.
Analysing the Galactic evolution of cometary perihelion distances, Matese & Lissauer (2004) introduced the so-called tidal characteristic ‘S’, which describes whether the perihelion distance of a particular comet decreases (S = −1) or increases (S = +1) during the observed perihelion passage. In a dynamical model restricted to the Galactic-disc tide, S = −sign[sin(2ω)]. Due to the relatively short time intervals, limited to one orbital period, and despite including the Galactic centre term in our calculations, we do not observe any departure from this simple relation. It means that for all comets investigated here their perihelion distances decrease due to the combined Galactic tides when the Galactic argument of perihelion, ω, is in the first or third quarter and increases otherwise. As discussed in Matese & Lissauer (2004) and recently in Matese & Whitmire (2011), this is the reason that dynamically new comets should have S = −1 (and ω in the first or third quarter) much more frequently. This, together with the distribution of the Galactic latitude of perihelion direction, b, is illustrated in Fig. 14.
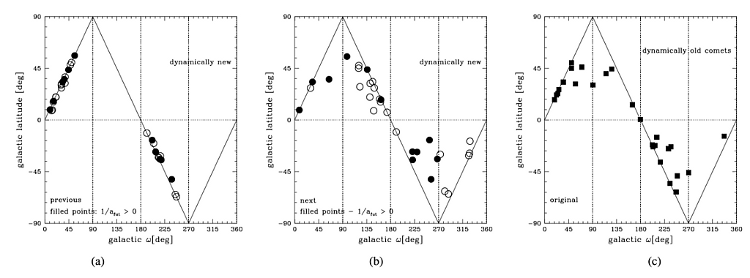
Fig. 14. Galactic ω versus Galactic latitude for previous perihelion passage or previous escape at 120 000 AU from the Sun (left-side and right-side panels are for dynamically new and dynamically old comets, respectively) or for the next perihelion passage or next escape at 120 000 AU from the Sun (middle panel for dynamically new comets). Right: almost all comets have galactic ω inside the first and third quarter; in the second and fourth quarter are five of six comets with qori > qprev: C/1972 L1, C/1976 D2, C/1980 E1, C/1997 J2, and C/1979 M3.
As in the previous plots, circles here denotes dynamically new comets and squares dynamically old ones; in the left and middle panel, filled symbols mark comets returning in the future while open symbols mark comets ejected in the future from the Solar system because they are moving along hyperbolic orbits. According to the relation sin b = sin ω sin i, comets may appear in this plots only between the horizontal b-zero axis and the solid ‘triangle’ lines. All angles are measured in the Galactic frame.
In the left panel of Fig. 14 we present perihelion latitude versus the argument of perihelion for nominal orbits of dynamically new comets at their previous perihelion passage. As described above, all circles are located along solid borders of the allowed region, and only in the first and third quarter of ω, which corresponds to the perihelion distance decreasing phase of Galactic evolution (S=−1).
The same comets but at the next perihelion passage (i.e. two orbital revolutions later) are plotted in the middle panel of Fig. 14. One can observe that almost all comets have moved significantly and all four quarters are populated more or less uniformly. There is also an intriguing asymmetry in the displacements of escaping and returning comets. The displacement of comets between the left and middle panels incorporates both Galactic orbital evolution during two consecutive revolutions and planetary perturbations during the observed perihelion passage.
The right panel of Fig. 14 is to be compared with the middle one. We present here angular elements of all (both returning and escaping) dynamically old comets at their previous perihelion passage. It is important to stress that the dynamical status of investigated comets (also the ‘dynamically new’ and ‘dynamically old’ descriptions in Fig. 14) is related to the observed perihelion passage. Thus, new returning comets at their next perihelion (only the filled points in the middle panel) should have angular element distributions qualitatively similar to those of old comets at their original perihelion passage (right panel). As one can easily observe, we obtained a high level of such similarity.
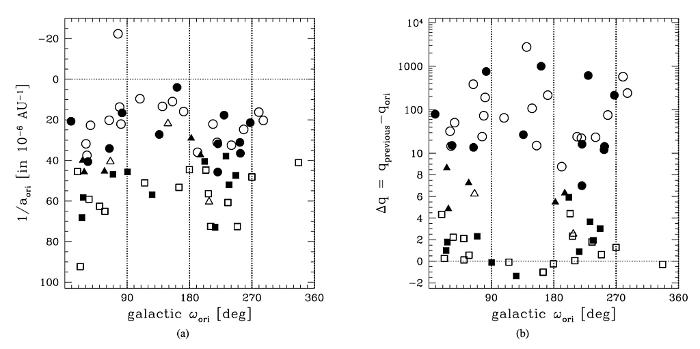
Fig. 15. Galactic argument of perihelion ω versus 1/aori (left panel) and Δq = qprev − qori (right panel) for all investigated comets (note the change from a linear scale to a logarithmic one in the middle of the vertical axis of the right panel). Circles and squares represent dynamically new and dynamically old comets, respectively, triangles comets with uncertain dynamical status. Filled and open symbols denote returning or escaping in the future. Six comets with the negative Δq, i.e. with qori > qprev (see also Table 8), can be located in the bottom part of this figure. These are (from left to right) C/1976 U1, C/1972 L1, C/1976 D2, C/1980 E1, C/1997 J2 and C/1979 M3.
Matese & Lissauer (2004) suggested that there should be a significant correlation between the tidal characteristics S (i.e. given quarter of ω) and the reciprocal of the semimajor axis 1/aori. As presented in Fig. 15, a much clearer correlation can be observed between ω and the change in the perihelion distance during the last orbital revolution: Δq = qprev − qori. It can be noticed that there are two distinct group of comets that are distributed in all four quarters of ω: dynamically new comets (which have the largest Δq) and dynamically old comets with negative Δq (described in Table 8). The dynamically old comets as well as all dynamically uncertain ones can be found only in the first and third quarters of ω.
4.4 NEW INTERPRETATIONS
Recently an interesting new scenario of LPC dynamical evolution was pointed out by Kaib & Quinn (2009). They showed, that in addition to preventing some LPCs from being observed, the Jupiter–Saturn barrier can help some inner Oort-cloud comets (a < 10 000 AU) to reach the observability zone. During the numerical simulation of the Oort-cloud dynamical evolution, they observed that a large percentage of the inner-cloud comets follow a common pattern: due to weak Galactic perturbations their perihelia slowly drift towards the Sun and at heliocentric distances of 15–20 AU they received a series of energy kicks from the giant planets, increasing their semimajor axis significantly (see fig. 1 in the quoted paper). At the late stage of this process, a comet with q ≅ 12 AU goes outside the planetary system along an orbit with a ≅ 28 000 AU and then returns to the Sun at any small perihelion distance due to strong Galactic perturbations received during this last orbital revolution.
They concluded that the majority of observed LPCs can be produced by such a mechanism, but except for mentioning two objects in strange orbits, 90377 Sedna (Brown, Trujillo & Rabinowitz 2004) and 2006 SQ372 (Kaib et al. 2009), they do not provide any real cometary examples.
In our study we obtained several results that can fit their prediction perfectly. By quick examination of Table 3, one can find that C/1978 A1, C/1997 BA6, C/2001 K3, C/2003 S3, C/2004 T3 and C/2007 Y1 are good candidates, as well as all seven comets from Table 4. Previous perihelia of all these comets (as well as many VCs of other comets) lie in the vicinity of the Jupiter–Saturn barrier and it seems to be quite acceptable that some of these comets were produced by the mechanism proposed by Kaib & Quinn (2009).
In Fig. 16 we present the past and future Galactic evolution of the nominal VCs of C/2001 K3. Its previous perihelion distance and original semimajor axis fit perfectly the scenario proposed by Kaib and Quinn (2009). Visiting the planetary system 5.7 million years ago at a heliocentric distance of 15 AU, it probably received significant perturbations from Jupiter and Saturn. Therefore the probability that it was just placed on a large semimajor orbit, previously being an inner-cloud member, seems to be quite significant.
In the future this comet is captured into a small semimajor axis orbit of ∼1500 AU, leaving the Oort spike permanently and having a next perihelion distance equal to the observed one (3.06 AU).
5 DISCUSSION AND CONCLUSIONS
As a continuation of Paper I, we attempted to characterize the past and future motion of the next sample of Oort-spike (1/aori < 1 × 10⁻⁴AU-1) comets. In order to minimize possible biases due to indeterminable NG effects, we decided to study here only comets having a perihelion distance qosc > 3 AU and precisely determined orbits. To this aim, we omitted both 11 LPCs with qosc > 3 AU discovered before 1970 and three comets still (at the moment of this writing) potentially observable. Such a complete sample of 64 large perihelion distance Oort-spike comets allows us to obtain some statistical characteristics of this sample, as well as individual past and future dynamics for all of them. In the process of osculating orbit determination, we succeed in NG-effect detection for 15 comets. Having a homogeneously obtained set of osculating orbits, we followed their motion numerically back and forth among planets, up to a heliocentric distance of 250 AU, obtaining original and future orbits. Instead of integrating one orbit per comet we replaced each body with a set of 5001 VCs and followed their motion individually. This allowed us to estimate all parameters of the original and future orbits, together with their uncertainties.
Then we analysed past and future motion of all VCs for one orbital period, including both Galactic disc and Galactic-centre tides and omitting the perturbations from all known stars. The latter was justified by Dybczyński (2006), who analysed by means of exact numerical integration the influence of all known stars on the population of LPCs. In table 6 of the quoted paper, he listed 22 long-period comets for which stellar perturbation changed the previous perihelion distance by more than 10%. Only four of the large perihelion distance LPCs studied in the present paper can be found in that table. In Table 11 we compare those results with the current calculations. There are several important differences between the calculations of Dybczyński (2006) and the present paper. First, we included here the Galactic-centre tidal term, noting its importance in some cases (Dybczyński 2006 used only the disc tidal term). Secondly, we homogeneously determined all cometary orbits directly from observations and additionally included NG effects where possible. Thirdly, we replaced each comet with a swarm of 5001 VCs, all compatible with the observations. This allowed us to observe the influence of the propagated observational uncertainties on the final results.
Table 11. The comparison of the previous perihelion distancees (all values are expressed in au) of C/1984 W2, C/1993 K1, C/1997 A1 and C/1997 J2 obtained in the present paper and in Dybczyński (2006). The influence of both stellar perturbations and the Galactic-centre tide term are demonstrated.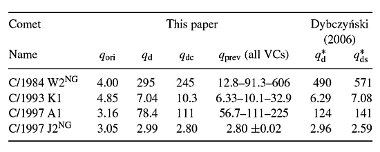
In Table 11 we present the current and previous results for four comets: C/1984 W2, C/1993 K1, C/1997 A1 and C/1997 J2, two of which have detectable NG effects (marked by the NG superscript after the comet designation). In the second column we included the perihelion-distance value for the original orbits obtained in this paper. The next two columns show the previous perihelion distance for the nominal orbit of these comets obtained without (qd) and with (qdc) the Galactic-centre tidal term. The next column of Table 11, qprev, presents the result of the observational uncertainties propagated back to the previous perihelion. The last two columns show the previous perihelion distances obtained by Dybczyński (2006): q∗d presents the value obtained only using the Galactic-disc tide while q∗ds denotes the value obtained when perturbations of the 21 most important stellar perturbers were included. One can easily note that the previous perihelion dispersion of VCs (column 5) is one order greater that the differences between the current and previous results, except in the case of comet C/1997 J2, where its current and past orbit can be determined with great accuracy. It can be observed that changes in the dynamical model of Galactic tides result in comparable (typically greater) changes in the previous perihelion distance to those after incorporating stellar perturbations (despite the fact that these comets are the most sensitive to known stellar perturbations, so these differences should be treated as extreme disparities).
It should be noted that even after including the action of all 21 strongest stellar perturbers (still far too weak to manifest themselves), our classification of these four comets does not change in any way: C/1984 W2 and C/1997 A1 are evidently dynamically new comets, C/1997 J2 is evidently dynamically old and C/1993 K1 remains as an uncertain case. Concerning the completeness of the stellar perturbers search, the reader is kindly directed to Dybczyński (2006), where possible sources of this incompleteness were discussed. We only summarize here those arguments stating that the omission of any important (i.e. massive and/or slow and/or travelling very close to the Sun) star seems rather improbable but not impossible. If such a star were discovered, its dynamical influence on the long-term dynamical evolution of all LPCs should be carefully studied. This would also change some particular results and conclusions presented here, if it happened.
Additionally it seems worth mentioning that the comet C/1997 J2 belongs to an interesting group of six comets listed in Table 8, for which we obtained a smaller previous perihelion distance than the observed one. As is clear from Table 11, for all compared dynamical models this classification remains unchanged. The swarms of VCs stopped at 250 AU from the Sun were followed numerically for one orbital revolution to the past and future and as a result we obtained the orbital characteristics of these objects at the previous and next perihelion passages with respect to the observed one. Both Galactic-disc and Galactic-centre tides were taken into account for all comets. Based on the previous perihelion distance, we divided a sample of 64 large perihelion Oort-spike comets into three groups: 26 dynamically old comets, 31 dynamically new comets and 7 comets with uncertain dynamical age.When analysing orbits at the next perihelion, we found that only 31 comets will remain Solar system members in the future. The rest of our sample, 33 comets, will leave our planetary system along hyperbolic orbits due to planetary perturbations.
Detailed results and plots for all individual comets studied in this paper as well as summarizing catalogues of orbits will successively appear at the WikiComet web page (Dybczyński & Królikowska 2011).
As a result of studying individual dynamical evolution as well as observing several interesting statistical characteristics of this sample of comets, we can draw the following main conclusions.
- Observation selection and weighting are crucial for precise orbit determination.
- Contrary to popular opinion, it is possible to determine orbits with NG parameters for some 25% of large perihelion distance Oort-spike comets.
- Incorporating these NG orbits makes the overall energy distribution of our sample significantly different, modifying the shape of the Oort spike and the position of the 1/aori peak.
- Replacing each individual comet with a swarm of virtual comets that ‘equally well’ represent the observations is a powerful method for analysing all uncertainties in the past and future motion of LPCs. This has allowed us, for example, to take the energy uncertainties into account when preparing the energy distribution.
- In the absence of the recognized recent stellar perturbations, it is quite possible to calculate previous perihelion distances of LPCs, taking into account the full Galactic potential.
- We have obtained a clear correlation between the calculated change in the perihelion distance and the reciprocal of the original semimajor axis. In contrast to some previous estimations, we obtained an exponent quite similar to the theoretically predicted one.
- On the basis of the obtained previous perihelion distance distributions, we are able to distinguish comets that were observed for the first time, i.e. dynamically new, from the rest of those comets that visit the observational zone at least twice – these are called dynamically old.
- By defining three different threshold values for strong planetary perturbations, we can easily divide all 64 comets into 26 dynamically new comets, 31 dynamically old comets and the remaining 7 comets, for which the dynamical status seems to be uncertain.
- With the analysis of Galactic angular orbital-element evolution we found several significant fingerprints of Galactic tides as a dominating agent delivering observable Oort-spike comets at present.
- In contrast to the overall picture of the so-called Jupiter–Saturn barrier, we found that almost 50% of our sample have previous perihelion distance below 15 AU. Moreover, we found several examples of comets that have moved through the Jupiter–Saturn barrier almost unperturbed. For six comets we found that the observed perihelion distance was even larger than the previous one.
- Among future orbits, we found 27 comets that will be observable during their next perihelion passage. In contrast, 33 comets will be lost due to hyperbolic ejection.
- We have also found that among 64 large perihelion distance Oort-spike comets almost 25% can be treated as possible results of the new source pathway from the inner Oort cloud to the observable zone recently proposed by Kaib & Quinn (2009).
ACKNOWLEDGMENTS
The research described here was partially supported by PolishMinistry of Science and Higher Education funds (years 2008–2011, grant no.NN203 392734). Part of the calculation was performed using the numerical orbital package developed by Professor Grzegorz Sitarski and the Solar System Dynamics and Planetology Group at SRC. The authors also thank Professor Sławomir Breiter for valuable discussions on some particular dynamical aspects of this research and Professor Giovanni Valsecchi who, as a referee, provided valuable comments and suggestions. This manuscript was partially prepared with LYX, the open source frontend to the TEX system.
REFERENCES
- Brown M. E., Trujillo C., Rabinowitz D., 2004, ApJ, 617, 645
- Byl J., 1986, Earth Moon and Planets, 36, 263
- Delsemme A. H., 1987, A&A, 187, 913
- Dones L.,Weissman P. R., Levison H. F., Duncan M. J., 2004, in Festou M.C., Keller H. U., Weaver H. A., eds, Comets II: Oort Cloud Formation and Dynamics. Univ. Arizona Press, Tucson, p. 153–174
- Duncan M. J., 2009, Sci, 325, 1211
- Duncan M. J., Quinn T., Tremaine S., 1987, AJ, 94, 1330
- Dybczyński P. A., 2001, A&A, 375, 643
- Dybczyński P. A., 2002, A&A, 383, 1049
- Dybczyński P. A., 2006, A&A, 449, 1233
- Dybczyński P. A., Królikowska M., 2011, http://apollo.astro.amu.edu.pl/WCP
- Emel’yanenko V. V., Asher D. J., Bailey M. E., 2007, MNRAS, 381, 779
- Fernández J. A., 1981, A&A, 96, 26
- Fernández J. A., 1994, in Milani A., di Martino M., Cellino A., eds, Proc. IAU Symp. Vol. 160, Asteroids, Comets, Meteors 1993. Kluwer, Dordrecht,p. 223
- Fernández J. A., ed., 2005, Astrophys. Space Sci. Libr.Vol. 328, Comets:Nature, Dynamics, Origin, and Their Cosmogonical Relevance. Springer,Berlin
- Fernández J. A., 2011, ApJ, 726, 33
- Festou M. C., Rickman H., West R. M., 1993, A&AR, 5, 37
- Fink U., 2009, Icarus, 201, 311
- Kaib N. A., Quinn T., 2009, Sci, 325, 1234
- Kaib N. A. et al., 2009, ApJ, 695, 268
- Królikowska M., 2001, A&A, 376, 316
- Królikowska M., 2004, A&A, 427, 1117
- Królikowska M., 2006, Acta Astron., 56, 385
- Królikowska M., Dybczyński P. A., 2010, MNRAS, 404, 1886
- Levison H. F., Dones L., Duncan M. J., 2001, AJ, 121, 2253
- Marsden B. G., Williams G. V., 2008, Catalogue of Cometary Orbits 17th Edition. Smithsonian Astrophys. Obser., Cambridge, MA
- Marsden B. G., Sekanina Z., Yeomans D. K., 1973, AJ, 78, 211
- Marsden B. G., Sekanina Z., Everhart E., 1978, AJ, 83, 64
- Matese J. J., Lissauer J. J., 2004, Icarus, 170, 508
- Matese J. J., Whitman P. G., 1989, Icarus, 82, 389
- Matese J. J., Whitman P. G., 1992, Celest. Mech. Dynam. Astron., 54, 13
- Matese J. J., Whitmire D. P., 2011, Icarus, 211, 926
- Morbidelli A., 2005, preprint (astro-ph/0512256)
- Oort J. H., 1950, Bull. Astron. Inst. Netherlands, 11, 91
- Oort J. H., Schmidt M., 1951, Bull. Astron. Inst. Netherlands, 11, 259
- Sitarski G., 1989, Acta Astron., 39, 345
- Sitarski G., 1998, Acta Astron., 48, 547
- Sitarski G., 2002, Acta Astron., 52, 471
- Weissman P. R., 1985, in Carusi A., Valsecchi G. B., eds, IAU Colloq. 83, Dynamics of Comets: Their Origin and Evolution. Assoc. Univ. Res. Astron. Washington, DC, p. 87
- Wiegert P., Tremaine S., 1999, Icarus, 137, 84
- Yabushita S., 1989, AJ, 97, 262
