C/2020 R7 ATLAS
more info
Comet C/2020 R7 was discovered on 15 September 2020, two years before its perihelion passage. Later a series of observations were found from 3 December 2019. This comet was observed until 31 July 2024 (as in February 2025).
Comet had its closest approach to the Earth on 15 Julyl 2022 (2.18 au); about 2 months before its perihelion passage.
Currently, the preferred NG solution given here is based on data span over 4.66 yr in a range of heliocentric distances: 9.08 au – 2.96 au (perihelion) – 6.81 au. This comet shows large trends in the O-C distribution for a purely gravitational orbit. However, still some trends in [O-C] are visible for NG solutions based on full data arc (see solution 'c5' or 'n5'), trends substantially decrease for NG orbit based on pre-perihelion data atc (solution 'pc').
This Oort spike comet suffers moderate planetary perturbations during its passage through the planetary system that lead to a more tight future orbit (semimajor axis of about 1,800 au).
| solution description | ||
|---|---|---|
| number of observations | 1836 | |
| data interval | 2019 12 03 – 2024 07 31 | |
| data type | perihelion within the observation arc (FULL) | |
| data arc selection | entire data set (STD) | |
| range of heliocentric distances | 9.08 au – 2.96 au (perihelion) – 6.81 au | |
| detectability of NG effects in the comet's motion | comet with NG effects strongly manifested in positional data fitting | |
| type of model of motion | GR - gravitational orbit | |
| data weighting | YES | |
| number of residuals | 3617 | |
| RMS [arcseconds] | 0.52 | |
| orbit quality class | 1a+ | |
| orbital elements (barycentric ecliptic J2000) | ||
|---|---|---|
| Epoch | 2330 09 04 | |
| perihelion date | 2022 09 15.55051023 | ± 0.00008265 |
| perihelion distance [au] | 2.95480852 | ± 0.00000025 |
| eccentricity | 0.99840862 | ± 0.00000095 |
| argument of perihelion [°] | 347.663286 | ± 0.000014 |
| ascending node [°] | 268.206546 | ± 0.000010 |
| inclination [°] | 114.934623 | ± 0.000009 |
| reciprocal semi-major axis [10-6 au-1] | 538.57 | ± 0.32 |
| file containing 5001 VCs swarm |
|---|
| 2020r7a5.bpl |
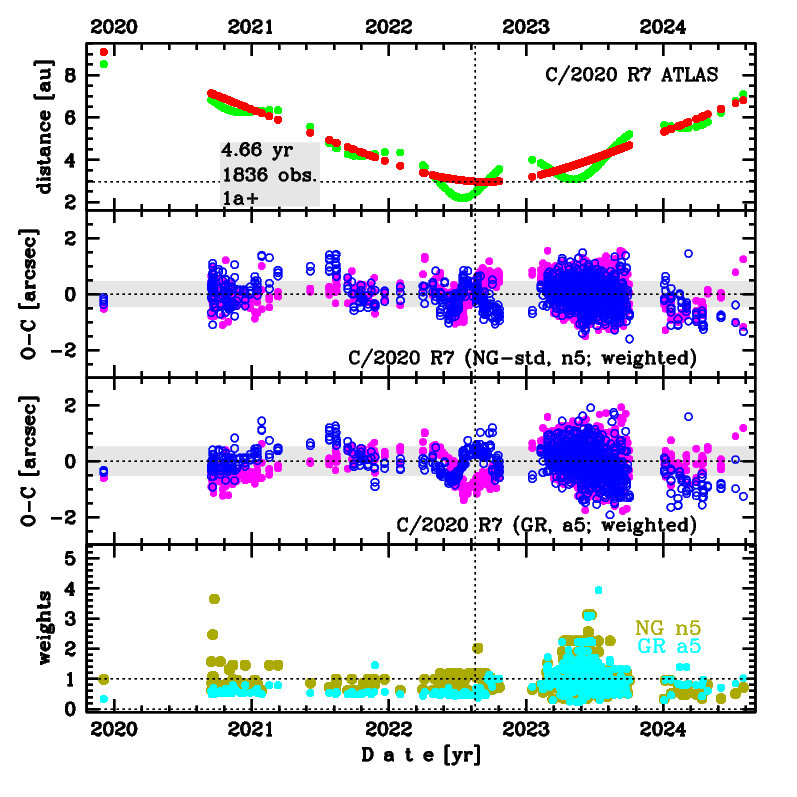
Upper panel: Time distribution of positional observations with corresponding heliocentric (red curve) and geocentric (green curve) distance at which they were taken. The horizontal dotted line shows the perihelion distance for a given comet whereas vertical dotted line — the moment of perihelion passage.
Middle panel(s): O-C diagram for a given solution (sometimes in comparison to another solution available in CODE), where residuals in right ascension are shown using magenta dots and in declination by blue open circles.
Lowest panel: Relative weights for a given data set(s).
Middle panel(s): O-C diagram for a given solution (sometimes in comparison to another solution available in CODE), where residuals in right ascension are shown using magenta dots and in declination by blue open circles.
Lowest panel: Relative weights for a given data set(s).

Six 2D-projections of the 6D space of future swarm including 5001 VCs. Each density map is given in logarithmic scale presented on the right in the individual panel.