C/2015 K4 PanSTARRS
more info
Comet C/2015 K4 was discovered on 24 May 2015 by Pan-STARRS 1, Haleakala, that is about three weeks after its perihelion passage. Comet was observed for less than two months until 14 July 2015. C/2015 K4 had closest approach to the Earth on 25 May 2015 (1.061 au, 3.5 weeks after the perihelion passage).
This is a comet with a short data arc and we show here two GR solutions differing in data treatment: 'a5' (data were weighting) and 'a1' (weighting procedure was omitted); bothare based on data spanning over 0.14 yr in a narrow range of heliocentric distances from 2.03 au to 2.20 au.
According to both GR solutions, original semimajor axis of C/2015 K4 is about 1100–1800 au (uncertainty of one sigma was included). Due to moderate planetary perturbations, its future orbit will be much looser; it is uncertain whether this comet will leave the solar system in a hyperbolic orbit.
| solution description | ||
|---|---|---|
| number of observations | 134 | |
| data interval | 2015 05 24 – 2015 07 14 | |
| data type | observed only after perihelion (POST) | |
| data arc selection | entire data set (STD) | |
| range of heliocentric distances | 2.03 au – 2.2au | |
| detectability of NG effects in the comet's motion | NG effects not determinable | |
| type of model of motion | GR - gravitational orbit | |
| data weighting | NO | |
| number of residuals | 259 | |
| RMS [arcseconds] | 0.54 | |
| orbit quality class | 2b | |
| previous orbit statistics, both Galactic and stellar perturbations were taken into account | ||
|---|---|---|
| no. of returning VCs in the swarm | 5001 | * |
| no. of escaping VCs in the swarm | 0 | |
| no. of hyperbolas among escaping VCs in the swarm | 0 | |
| previous reciprocal semi-major axis [10-6 au-1] | 567.58 – 736.73 – 905.34 | |
| previous perihelion distance [au] | 2.00642 – 2.00655 – 2.00675 | |
| previous aphelion distance [103 au] | 2.2 – 2.7 – 3.5 | |
| time interval to previous perihelion [Myr] | 0.036 – 0.05 – 0.074 | |
| percentage of VCs with qprev < 10 | 100 | |
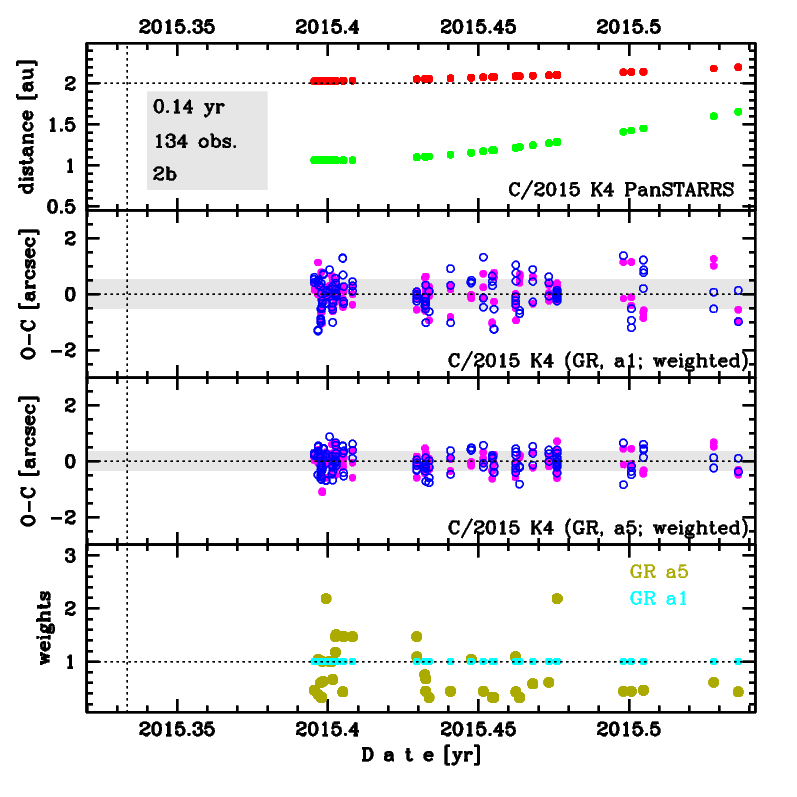
Upper panel: Time distribution of positional observations with corresponding heliocentric (red curve) and geocentric (green curve) distance at which they were taken. The horizontal dotted line shows the perihelion distance for a given comet whereas vertical dotted line — the moment of perihelion passage.
Middle panel(s): O-C diagram for a given solution (sometimes in comparison to another solution available in CODE), where residuals in right ascension are shown using magenta dots and in declination by blue open circles.
Lowest panel: Relative weights for a given data set(s).
Middle panel(s): O-C diagram for a given solution (sometimes in comparison to another solution available in CODE), where residuals in right ascension are shown using magenta dots and in declination by blue open circles.
Lowest panel: Relative weights for a given data set(s).
| previous_g orbit statistics, here only the Galactic tide has been included | ||
|---|---|---|
| no. of returning VCs in the swarm | 5001 | * |
| no. of escaping VCs in the swarm | 0 | |
| no. of hyperbolas among escaping VCs in the swarm | 0 | |
| previous reciprocal semi-major axis [10-6 au-1] | 567.58 – 736.73 – 905.34 | |
| previous perihelion distance [au] | 2.00633 – 2.00642 – 2.00653 | |
| previous aphelion distance [103 au] | 2.2 – 2.7 – 3.5 | |
| time interval to previous perihelion [Myr] | 0.036 – 0.05 – 0.074 | |
| percentage of VCs with qprev < 10 | 100 | |