Oral presentation during the IAU Coll. No.173,
Evolution and Source Regions of Asteroids and Comets,
Tatranská Lomnica, August 24-28, 1998
(never published in the printed form)
I have presented here the results of large Monte Carlo simulations of stellar and galactic perturbations on the Oort cloud [OC] of comets, performed in 1997 - 1998.
Step 4 is necessary for excluding all comets which visited the planetary region in the past and are assumed to be removed from the OC.
Step 6 is used to check, whether the comet may be observable after some time. If not - it is useless to integrate its orbit.
Tested..........................................7.9 x 1010comets,
Never in planetary region.......................7.1 x 1010comets,
Transferred to the observable sub-population....6.9 x 105 comets,
Observable in the first 20 mln years............7.3 x 103 comets,
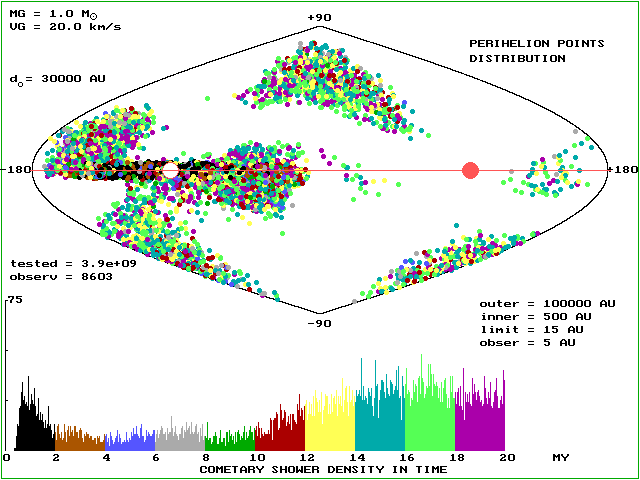
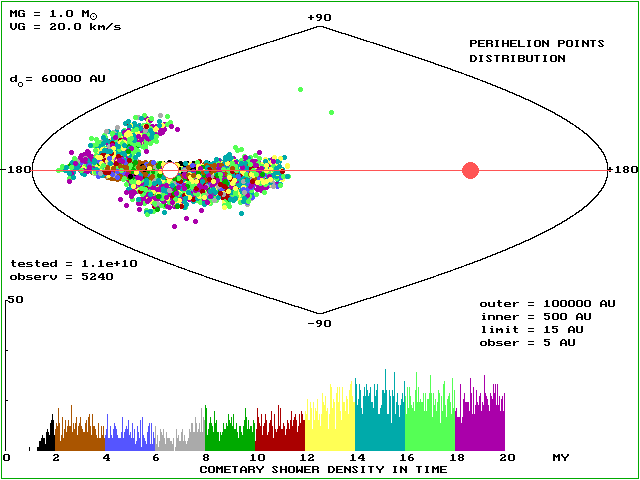
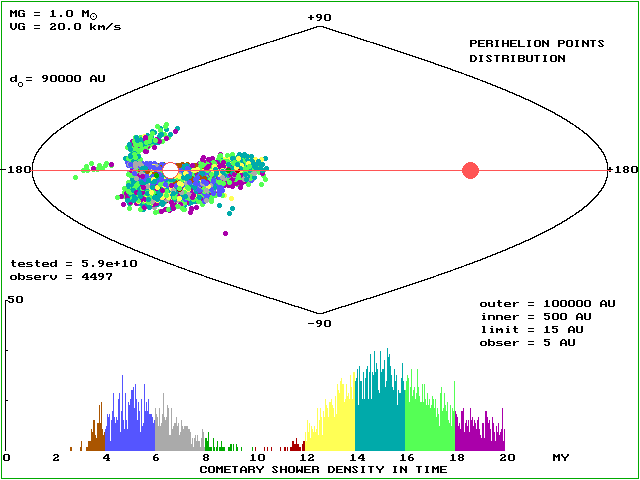
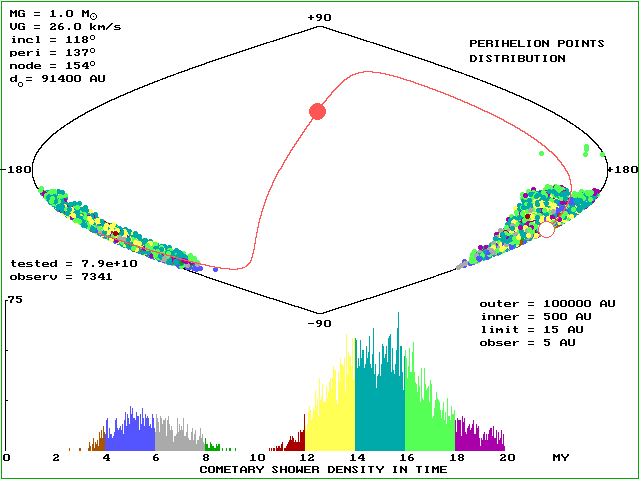
Three major simulations was performed: for minimal sun-star distances of 30000, 60000 and 90000 AU. The resulting distribution of observable comets for the first case, plotted in the stellar frame looks like this:

The upper panel shows the distribution of perihelion directions on the
celestial sphere in equal-area projection - colors of dots represent
the time of the arrival at the planetary system described in the lower
part of the picture as the time distribution. Outer
and inner are variables defining the cometary cloud
boundaries, limit is the minimal acceptable heliocentric
distance of a comet at previous returns and obser is the
observability threshold.
Tested gives the total number of comets in the simulated
OC and observ gives the number of obtained observable
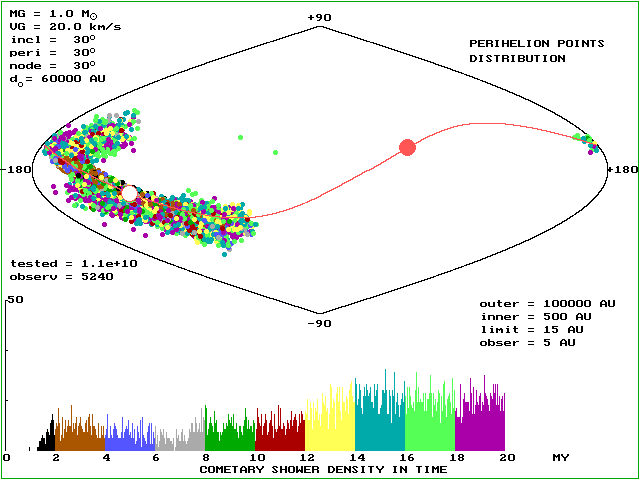
comets (number of dots on the sphere). MG is the stellar mass,
VG is the stellar velocity, incl ,
peri and node are inclination, argument
of perihelion and the longitude of the ascending node respectively.
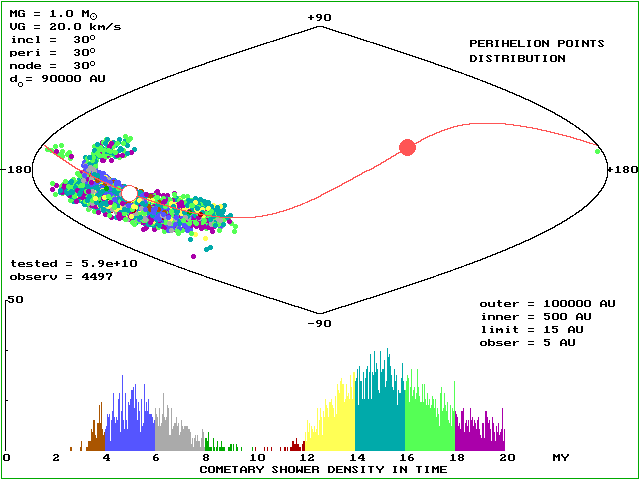
The same can be shown in the galactic frame:
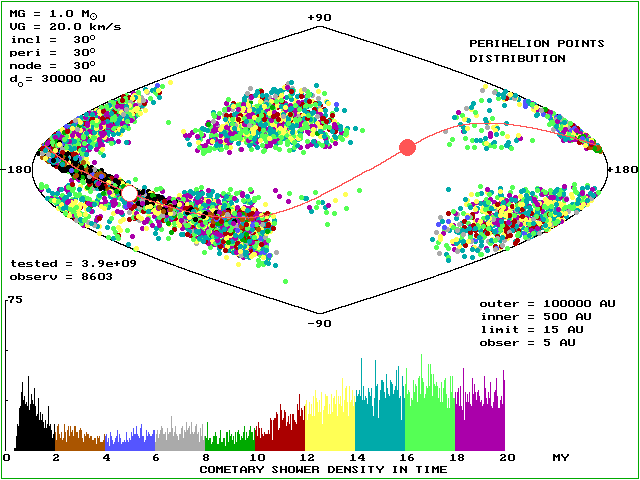
Red line represents the heliocentric orbit of the stellar perturber, small circle filled with red is the perihelion direction of the star and the empty one is the "anti-perihelion" direction (stellar orbit is always hyperbolic).
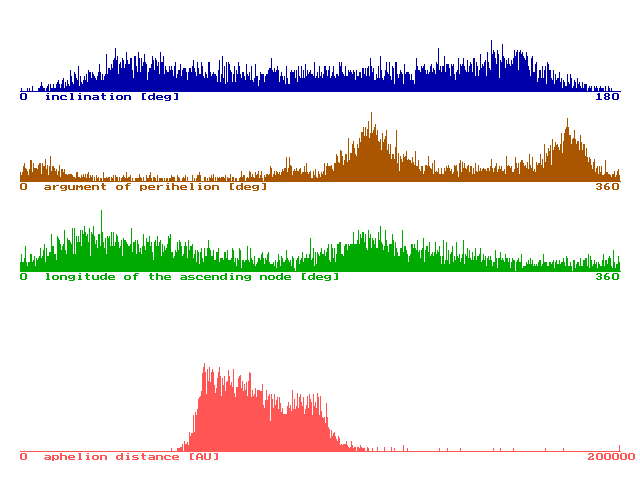
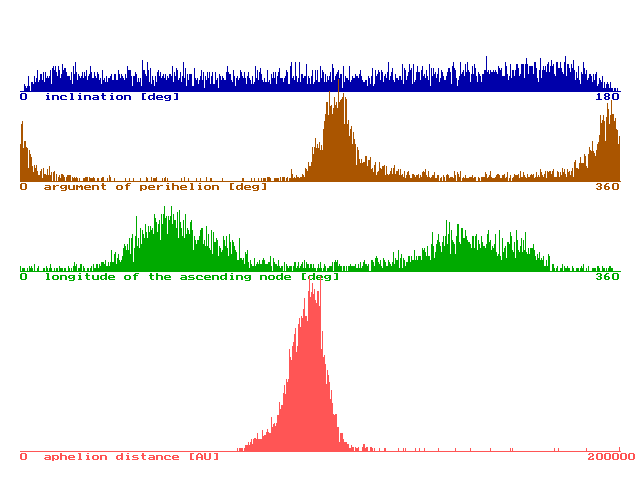
The distribution of keplerian, orbital elements of this observable comet population looks like this:
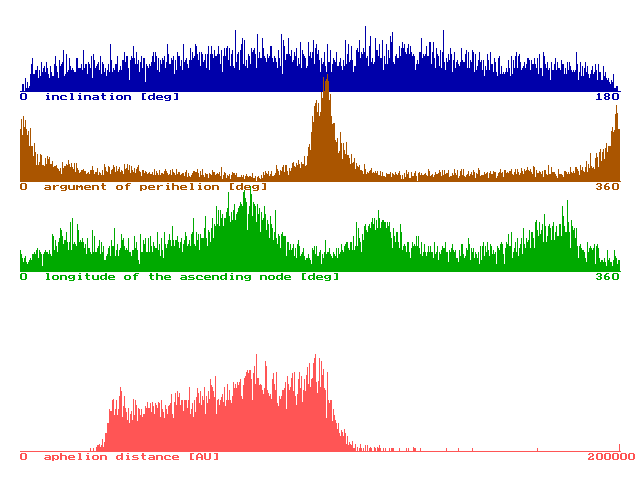
The above elements are calculated with respect to the stellar orbit plane,
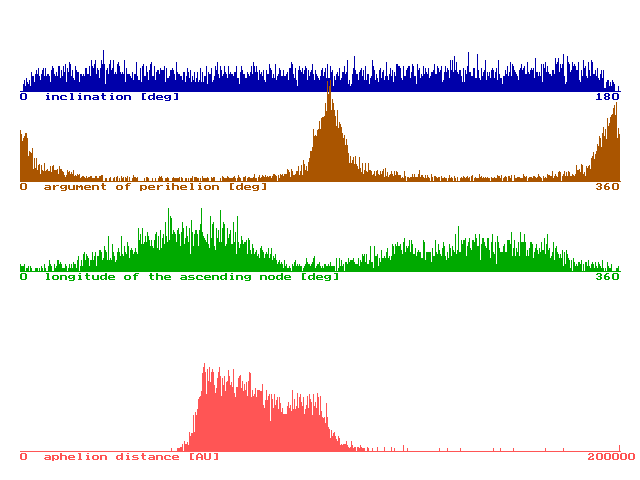
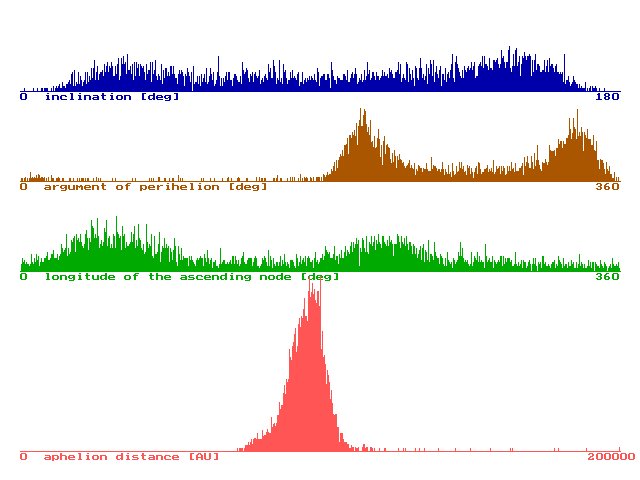
and transformed to the galactic frame looks like this:
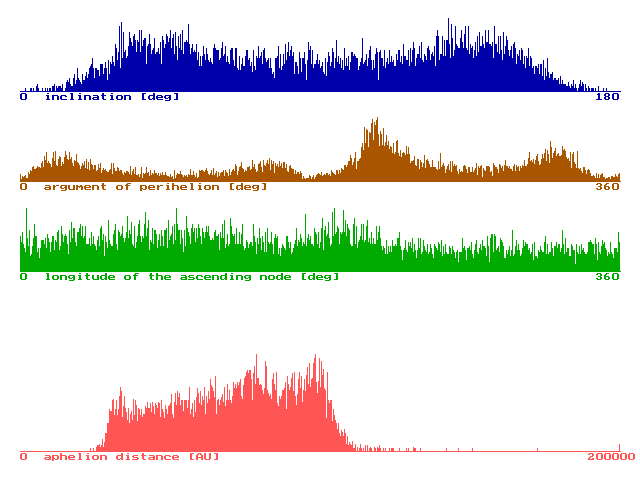
The distribution of aphelion distance is the same on both plots of course.
and the same in the galactic frame:
And orbital elements (in the stellar frame):
and in the galactic frame:
Finally look at the results for a real star ( 3709 Gliese NN):
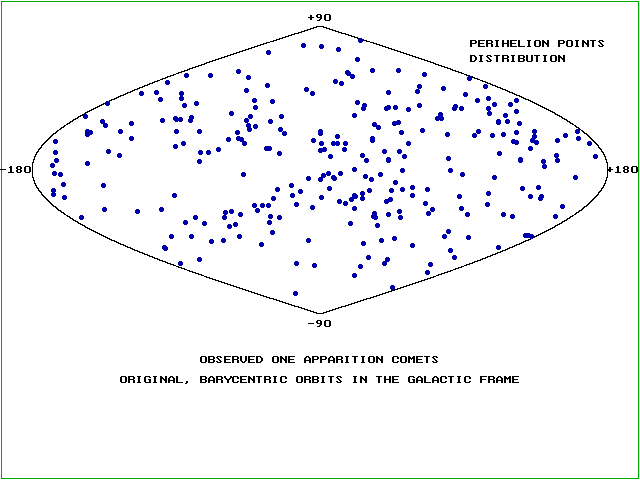
Remember, that we want to compare obtained population of observable comets with the real population of the observed long period comets. But this population consists of some 300 comets, and looks like this:
If you are looking for a fingerprint of some real stellar passage you can plot the orbits of stars on the same sphere:
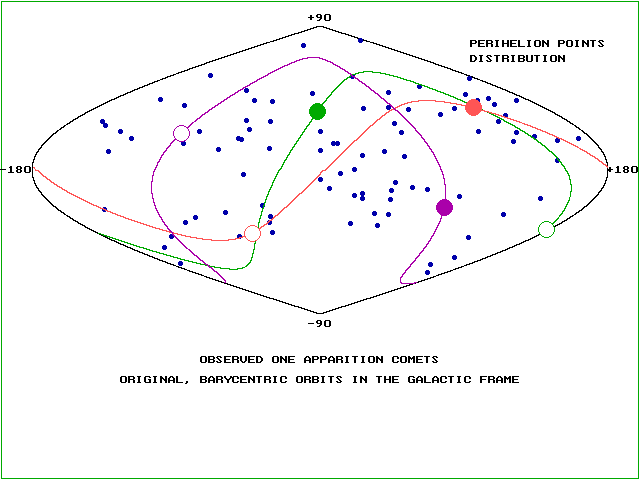
Red is the orbit of 945 Gliese 208, magenta is for 529 Gliese 120.1A and finally green represents the orbit of 3709 Gliese NN. The population of the observed long period comets is restricted here to comets with aphelion distances greater than 10000 AU.
Selected references: